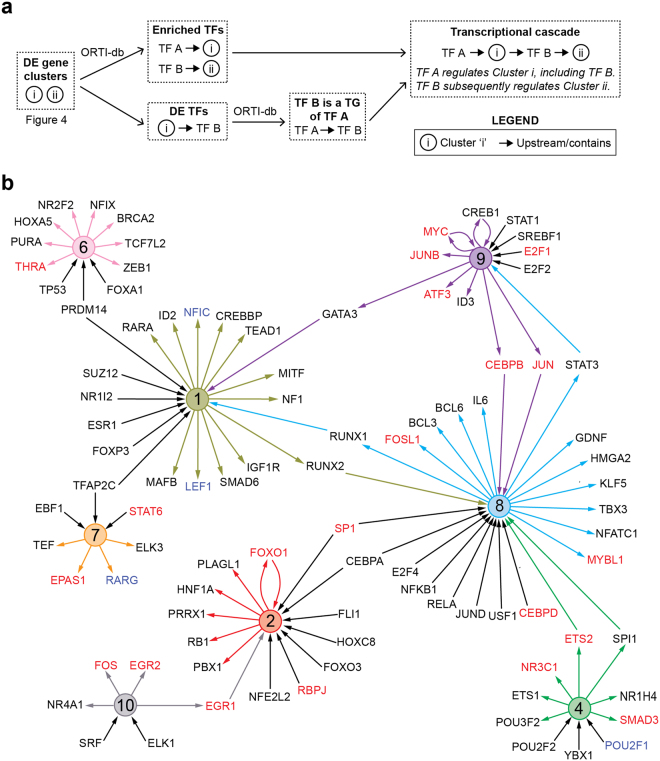
Figure 5.
Construction of the transcription cascade triggered in response to oxidative stress. (a) Schematic depicting the construction of the cascade. Using the clusters generated in Fig. 4, differentially-expressed transcription factors (TFs) are identified. For each cluster, enriched TFs are determined using the ORTI database18, which contains validated target genes (TGs) for each TF. The list of enriched TFs and associated statistics can be found in Supplementary Table S4. In the example, TF A is enriched in Cluster [i], placing TF A upstream of Cluster [i]. TF B is differentially-expressed in Cluster [i], a target gene of TF A, and enriched in Cluster [ii]. This places TF B in between Cluster [i] and [ii]. (b) The transcriptional cascade resulting from the steps performed in (a). Each coloured circle depicts the cluster number corresponding to the clusters in Fig. 4. Arrows pointing away from cluster circles denote differentially-expressed TFs and arrows pointing towards cluster circles denote TFs enriched in that cluster. If a TF is differentially-expressed in one cluster and enriched in another, its adjacent lines adopted the colour of the cluster in which it was differentially-expressed – this served to highlight TF-cluster interactions that connected two clusters together. TF labels in red font denotes TFs that were transcriptionally upregulated in early adipogenesis18, whilst blue font denotes downregulation in expression.

