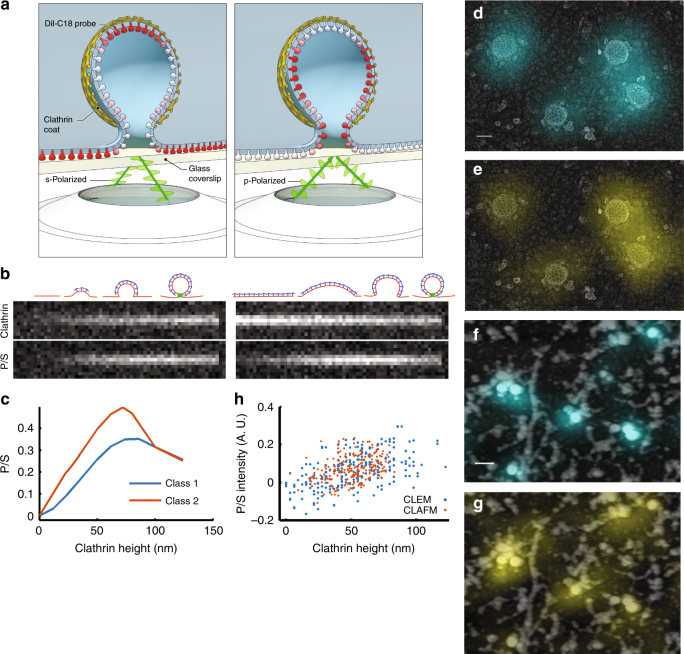
Fig. 2.
Polarized-TIRF microscopy enables imaging of membrane bending at clathrin-coated structures. a Schematic representation of pol-TIRF. DiI–C18 orients its dipole moment with the plasma membrane. S-polarized TIRF illuminates horizontal dye molecules, whereas P-polarized TIRF selectively excites vertical dye molecules. The P/S provides contrast for membrane bending. b Simulation of pol-TIRF signals for Class 1 and Class 2 membrane bending. c Quantification of high-resolution simulation at 10 discrete points for Class 1 (blue) and Class 2 (orange) in the absence of noise. d Correlative TEM-pol-TIRF imaging. Overlay of fluorescence from endogenous clathrin-Tq2 on the TEM micrograph showing four clathrin structures; scale bar is 100 nm. e Overlay of P/S on the same region of the micrograph. f Correlative AFM-pol-TIRF imaging; Overlay of clathrin-Tq2 on AFM micrograph; scale bar is 250 nm. g Overlay of P/S signal on the same region of the AFM micrograph. h Quantification of P/S intensity and heights from correlative tomographic reconstructions (blue), and AFM (orange)

