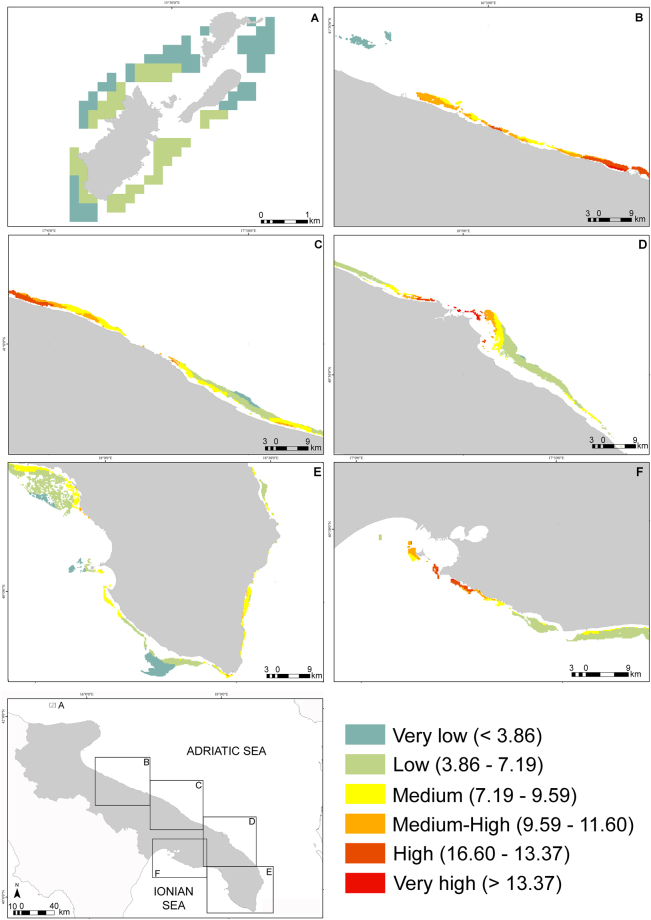
Figure 4.
Regional map (WGS84) of cumulative impact score (Ic) to coralligenous assemblages calculated following the best fitting model (log-log). The whole extent of coralligenous outcrops within 30 m depth at a regional scale was split into six sectors (a–f) to help displaying the spatial distribution of Ic. All coloured polygons in the map represent the areas characterized by the presence of coralligenous outcrops, whereas different colours indicated different levels of the expected cumulative impact on the outcrops. Limits of Ic defining different ranks of expected impact, from very low to very high, were reported in brackets. Maps were created using the ArcGIS® 10.1 software by ESRI (Environmental Systems Resource Institute, http://www.esri.com).

