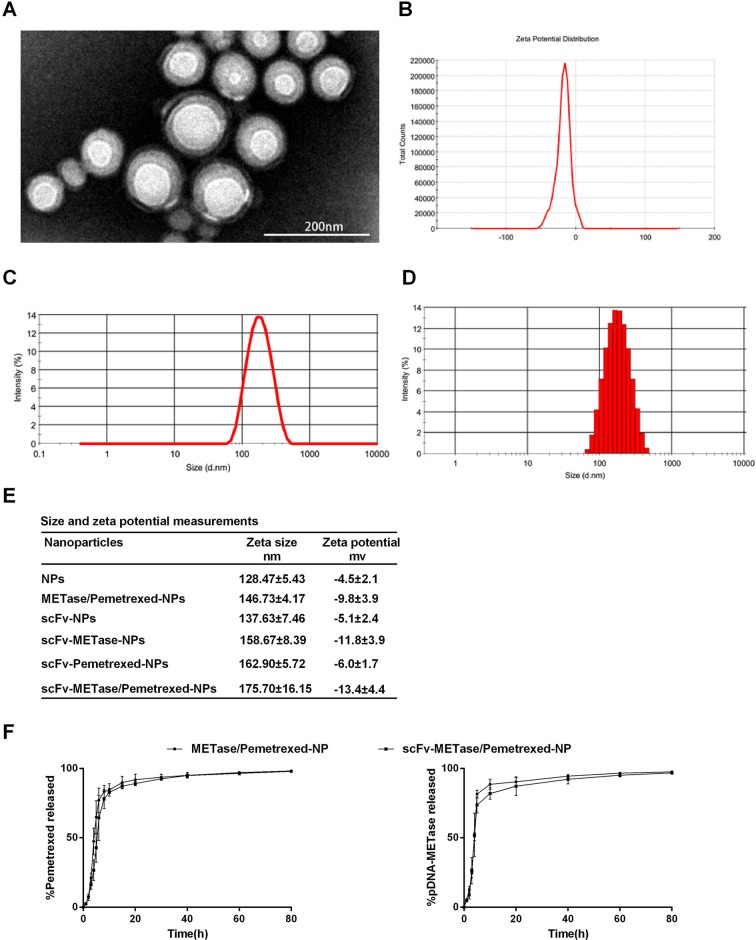
Figure 1. Structure characterization of METase/Pemetrexed-loaded scFV–NPs and in vitro drug release.
(A) TEM image of scFV–METase–/Pemetrexed–NPs. (B) Zeta potential distribution of scFV–METase–/Pemetrexed–NPs. (C and D) Size distribution based on intensity of scFV–METase–/Pemetrexed–NPs. (E) Size and Zeta potential analysis of different NPs. (F) In vitro release of pemetrexed and pDNA–METase from METase–/Pemetrexed-loaded-NPs and scFV–METase–/Pemetrexed-loaded-NPs. All data were expressed as mean ± standard error (SE).

