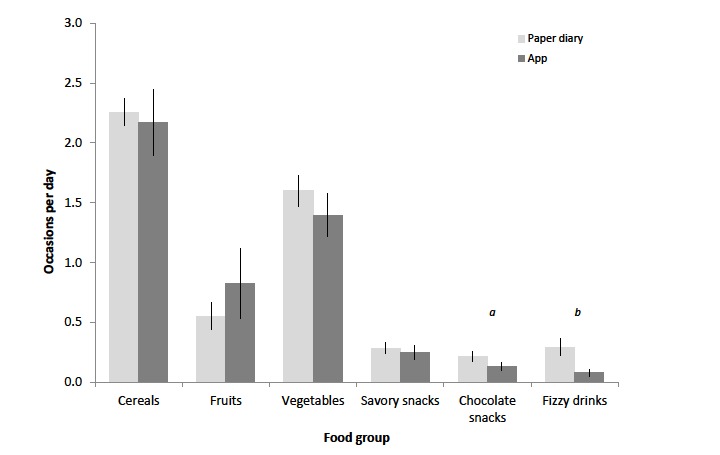
Figure 2.

Analysis of records per food group for the paper diary and app. Data are expressed as an average per day on which a total >500 kcal was recorded. Errors are expressed as standard error of the mean (SEM, n= 32). There is a significant difference between the use of paper diaries and the app in the recording of chocolate snacks and fizzy drinks (a: P=.012; b: P=.002).
