Figure 1.
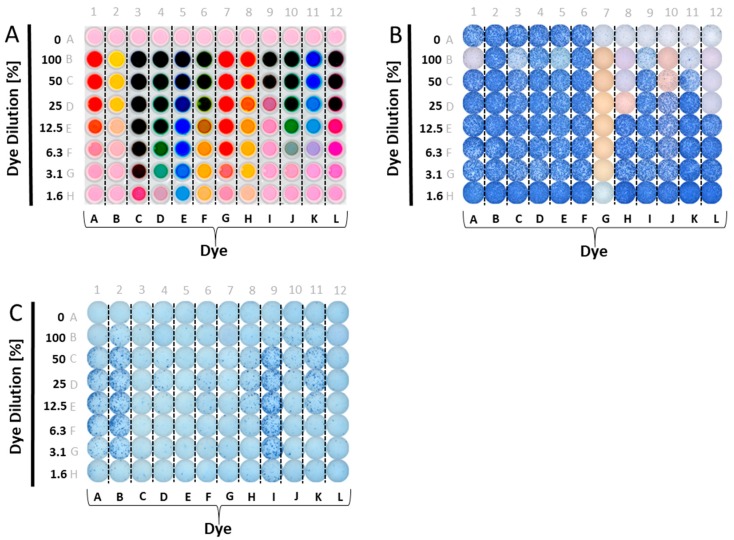
Testing candidate reagent tracker dyes for their interference with ELISPOT test results. (A) Candidate reagent tracker dyes were admixed to phenol red-containing test medium in the concentrations specified on the Y axis—a different dye for each column, as specified on the X-axis. Row A contains CEF-7 (wells A1-A6) or test medium alone (wells A7-A12). Each well contained 200 μL. A top-lit photograph of the experimental plate is shown. (B) The scanned well image of an ELISPOT plate is shown in which CEF 7 peptide-induced IFN-γ production by a single PBMC donor was measured. In row A, the PBMC were tested without the dyes present; wells A1–A6 are replicates containing the CEF-7 peptide at 1 μg/mL, and wells A7–12 are replicates for the medium control, with PBMC in medium alone. In all other wells CEF-7 peptide was present at 1 μg/mL, along with the dyes at the concentrations specified in the layout shown in (A); (C) The scanned image of an ELISPOT plate is shown in which IFN-γ production by a single donor was measured in the absence of antigen added; the PBMC were exposed only to the specified dyes or medium. In row A, in 12 replicate wells, PBMC were tested in medium alone, without the dyes present. In all other wells, the specified dyes were admixed to medium in the concentrations specified in the dye layout shown in (A). Note the occasional differential membrane staining in B vs. C: the staining seen at high dye concentrations with ethanol pre-wetting (B) was not seen without pre-wetting (C).

