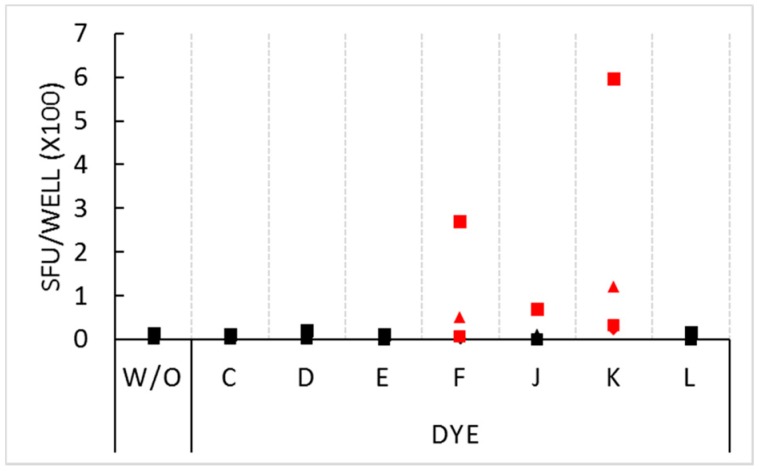
Figure 2.
Stimulatory effect of select dyes at 1.5% concentration. PBMC of four donors, distinguished by four symbols, were plated at 3 × 10⁵ cells per well in medium alone (without inclusion of dyes or antigen, W/O), or with the dyes specified on the X axis (also without antigen added). Each condition was tested in three replicate wells with the mean spot count shown on the Y axis. SFU counts that exceeded the threshold for statistical significance (p < 0.01) by the Student’s t-test are represented with red symbols.

