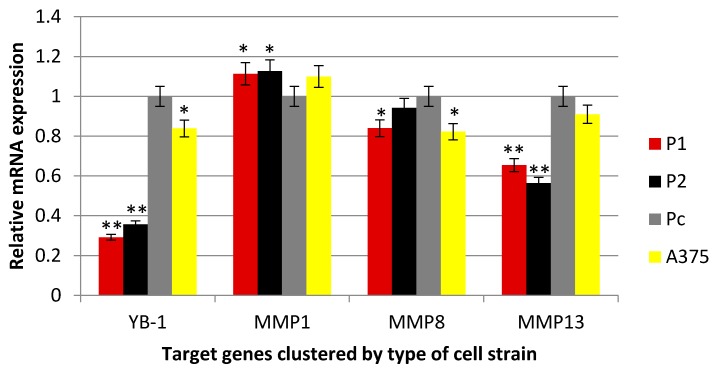
Figure 2.
Real-time PCR analyses.YB-1 and matrix collagenases (MMP1, MMP8, and MMP13) gene expression analysis to detect the relative mRNA expression of each gene in the transfected cells with the comparison with parent A375 cell line level. The Ct values were presented as mean ± standard error and were normalized first with internal control genes. One way ANOVA test was used to analyze the data, * p < 0.05, ** p < 0.001.

