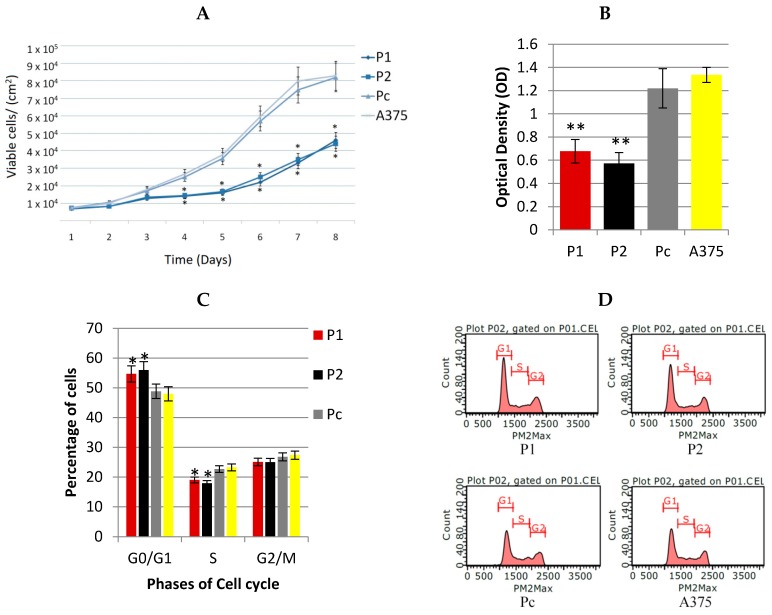
Figure 5.
Anti-proliferative effects of YB-1 shRNA (A) Colorimetric MTT assay performed by measuring the value of optical density at a wavelength of 590 nm with a reference filter of 620 nm by TECAN Infiniti plate reader; (B) Serial cell counting for different cell strains to detect the pattern of exponential cell growth by trypan blue stain; (C,D) Flow cytometry cell cycle analysis of the different cell strains to detect any interference by YB-1 shRNA by Guava easyCyte flow-cytometer. All the quantitative results were presented as means ± standard error compared with Pc cell strain and analyzed using one-way ANOVA, * p < 0.05, ** p < 0.001.

