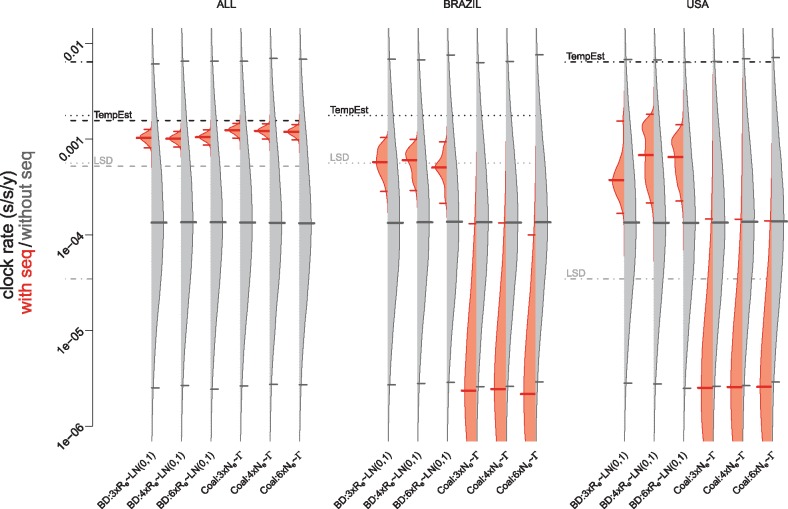
Figure 4.
The effect of addition of sequence data on the clock rate estimates in the Bayesian analysis. The probability distribution of the clock rate (rate.mean parameter) estimates resulting from the analysis with (red) and without (gray) sequences is shown. The figure shows estimates obtained under various model assumptions (labels on the x-axis summarize the models as explained in Table 1) and the three different data sets (header). The median clock rate is indicated with a thick solid line and the 95% HPD interval marked with thin solid lines. The black dashed, dotted, and dashed-dotted lines represent the clock rate estimates based on the TempEst analysis (Fig. 2) for the ALL, BRAZIL, and USA data sets, respectively. The gray dashed, dotted, and dashed-dotted lines represent the clock rate of the LSD estimates for the ALL, BRAZIL, and USA data sets, respectively. The become uninfectious rate in the BD model is set to δ = 18.25, which is the mean estimate in Ferguson et al. (2016). The clock rate displayed is in units of s/s/y, i.e. subst/site/year.

