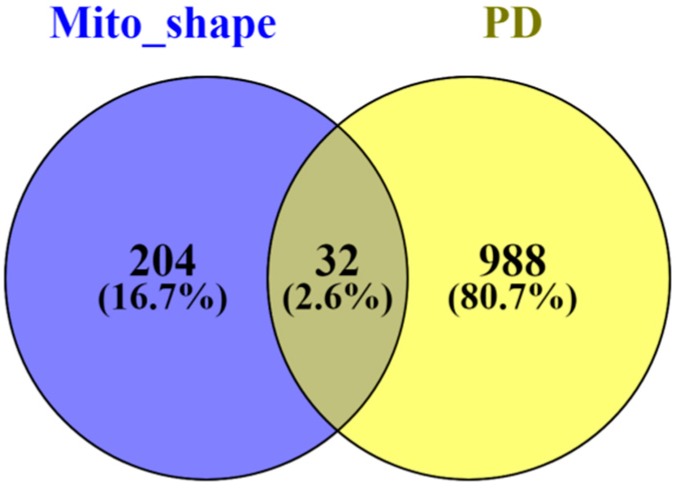
Figure 2.
Venn diagram displaying the comparison of the number of the proteins found differentially expressed in the context of Parkinson’s disease (Supplementary Table S1) and the mitochondrial-shaping proteins described in the literature (Table 1). The Venn diagram was constructed using the Venny 2.1 software [71]. PD—Parkinson’s disease.

