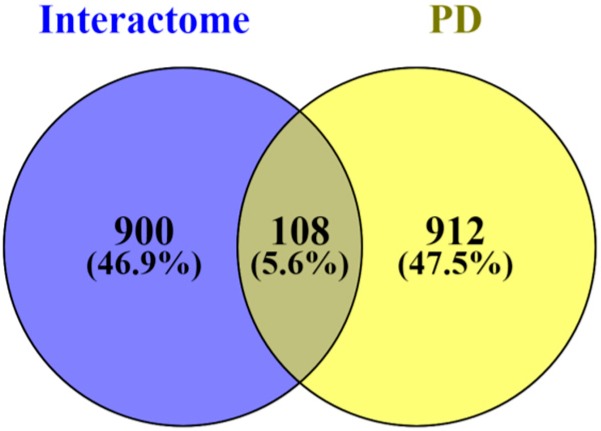
Figure 3.
Venn diagram displaying the comparison of the number of the binding partners of the mitochondrial-shaping proteins affected in Parkinson’s disease (Table 2) and the proteins found to be differentially expressed in the context of Parkinson’s disease (Supplementary Table S1). The Venn diagram was constructed using the Venny 2.1 software [71]. PD—Parkinson’s disease.

