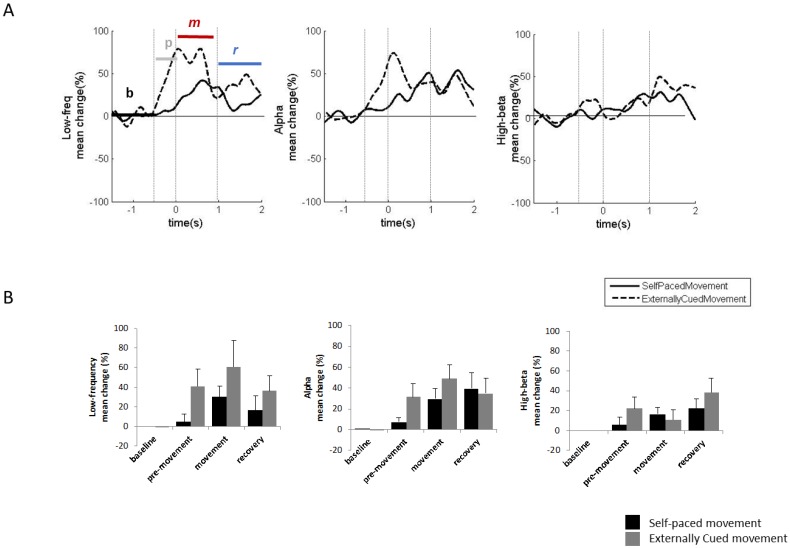
Figure 2.
Vo/CM-Pf LFP power modulation during voluntary movements. (A) Grand average (n = 7) of the low-frequency (left plot), alpha (central plot), and high beta (right plot) power modulations during self-paced voluntary movements (solid black line) and externally-cued movements (dashed black line). Power modulations are expressed as percentage changes from the baseline phase and were estimated starting from 1.5 s before the movement onset until 2 s after the movement onset. The four movement-related phases were baseline (b), pre-movement (p), movement (m), and recovery (r). x-axis: time (s); y-axis: Hilbert-power modulations (Percentage). (B) The histograms represent the mean power modulation for low-frequency (left plot), alpha (central plot), and high beta (right plot) bands in the four movement phases (baseline, pre-movement, movement, and recovery) for self-paced movements (black bars) and externally-cued movements (grey bars). Error bars represent the standard error.

