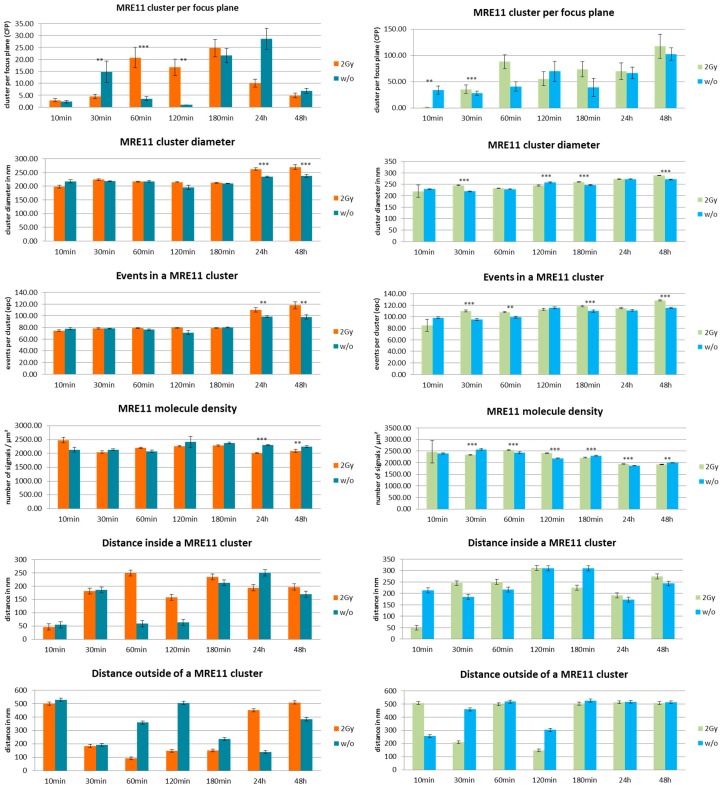
Figure 4.
Overview of the results obtained from SMLM measurements. Left panels show the data obtained from MCF-7 breast cancer cell nuclei; right panels show the data obtained from cell nuclei of CCD-1059SK fibroblasts. The columns of each panel represent the mean values calculated from 20 nuclei each. The error bars on top of the column indicate the standard deviation. For each time step after the irradiation process, the data are given for cells exposed to 2 Gy low LET ionizing radiation (“2 Gy”) and for cells subjected to the same culturing procedure but not to radiation treatment (“w/o”). Level of significance between the corresponding values for “2 Gy” and “w/o”: *** = 0.1%; ** = 1%. For further details see text.

