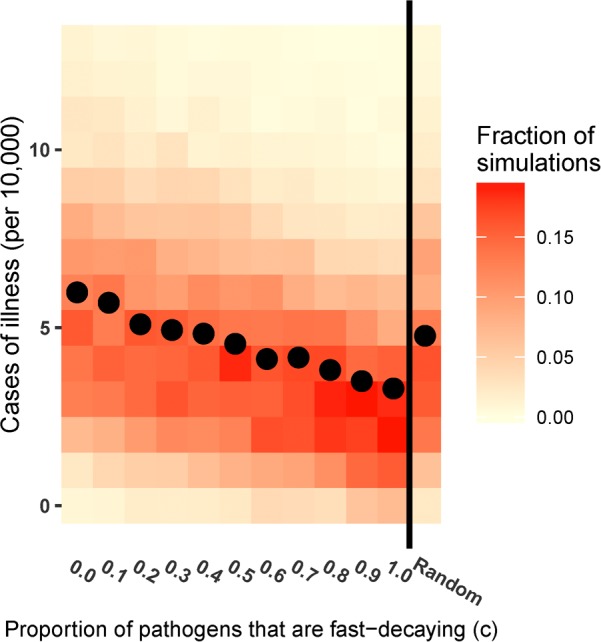
Figure 5.

Heatmap displaying the fraction of simulations that have each number of cases of illness in a year in a population of 10 000, both as a function of c, the proportion of pathogens that are fast decaying, and with c chosen randomly each day. The mean number of cases is shown with a dot.
