Figure 2.
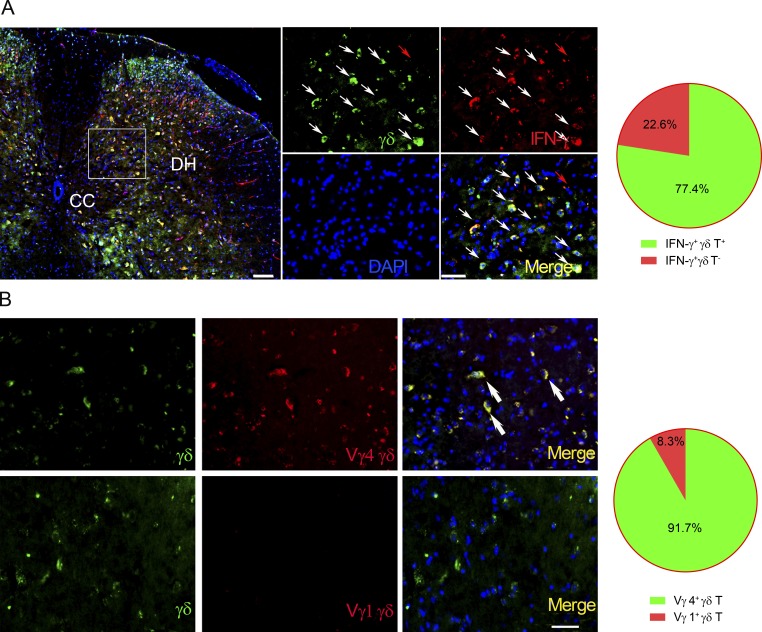
γδ T cells are recruited to the injury site and express IFN-γ. Spinal cord transverse sections from WT mice 24 h after injury. (A) TCR δ-GFP mice were sacrificed at 24 h after SCI, and spinal cords were prepared for immunohistochemistry. Sections were stained and read by confocal microscopy. DAPI shows the nucleus. The percentage of γδ T cells and non-γδ T cells in total IFN-γ+ cells was calculated and is shown in the pie chart. White arrows point to IFN-γ–producing γδ T cells. Red arrows point to IFN-γ+ γδ TCR cells. CC, central canal; DH, dorsal horn. (B) Double immunofluorescence showed that most γδ T cells were Vγ4 positive (indicated by arrows), but not Vγ1 positive. Bars, 50 µm. n = 6 mice per group. One representative of at least two independent experiments is shown.

