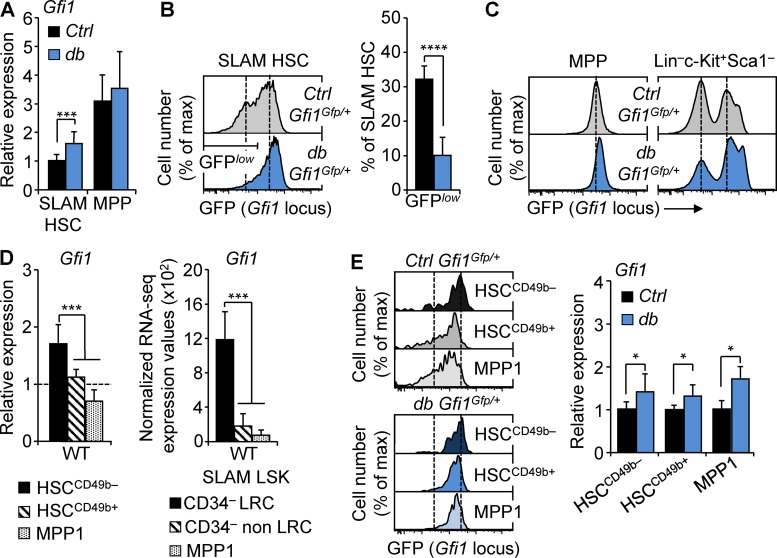
Figure 4.
Gfi1 up-regulation in obesity affects all HSC subsets. (A) qRT-PCR analyses for Gfi1 gene expression in SLAM HSCs and MPPs isolated from 4-mo-old Ctrl and db mice. Results are expressed as fold change ± SD relative to Ctrl SLAM HSCs. n = 12 pools of 100 cells. (B) Representative FACS plots showing GFP fluorescence in SLAM HSCs of 4-mo-old Ctrl::Gfi1Gfp/+ and db::Gfi1Gfp/+ mice. Graph indicates mean percentages ± SD of GFPlow SLAM HSCs. n = 4/group. (C) Representative FACS plots showing GFP fluorescence in MPPs (left) and in LK progenitors (right) of Ctrl::Gfi1Gfp/+ and db::Gfi1Gfp/+ mice. n = 4/group. (D) qRT-PCR analyses for Gfi1 gene expression in HSC subsets isolated from WT mice. Results are expressed as fold change ± SD relative to total SLAM HSCs. n = 6 pools of 100 cells. The right panel shows mean RNA-seq expression for Gfi1 transcripts in dormant long-term label-retaining cell (LRC) HSCs, active non-LRC HSCs, and MPP1 cells (n = 3; Cabezas-Wallscheid et al., 2017). (E) Representative FACS plots showing GFP fluorescence in HSC subsets of 4-mo-old Ctrl::Gfi1Gfp/+ and db::Gfi1Gfp/+ mice. n = 3/group. The right panel shows qRT-PCR analyses for Gfi1 gene expression in HSC subsets isolated from db mice. Results are expressed as fold change ± SD relative to their respective controls. n = 6 pools of 100 cells. Student’s t test (A, B, and E) or one-way ANOVA with Tukey’s post hoc test (D); *, P ≤ 0.05; ***, P ≤ 0.0005; ****, P ≤ 0.00005. Two independent experiments.

