Figure 1.
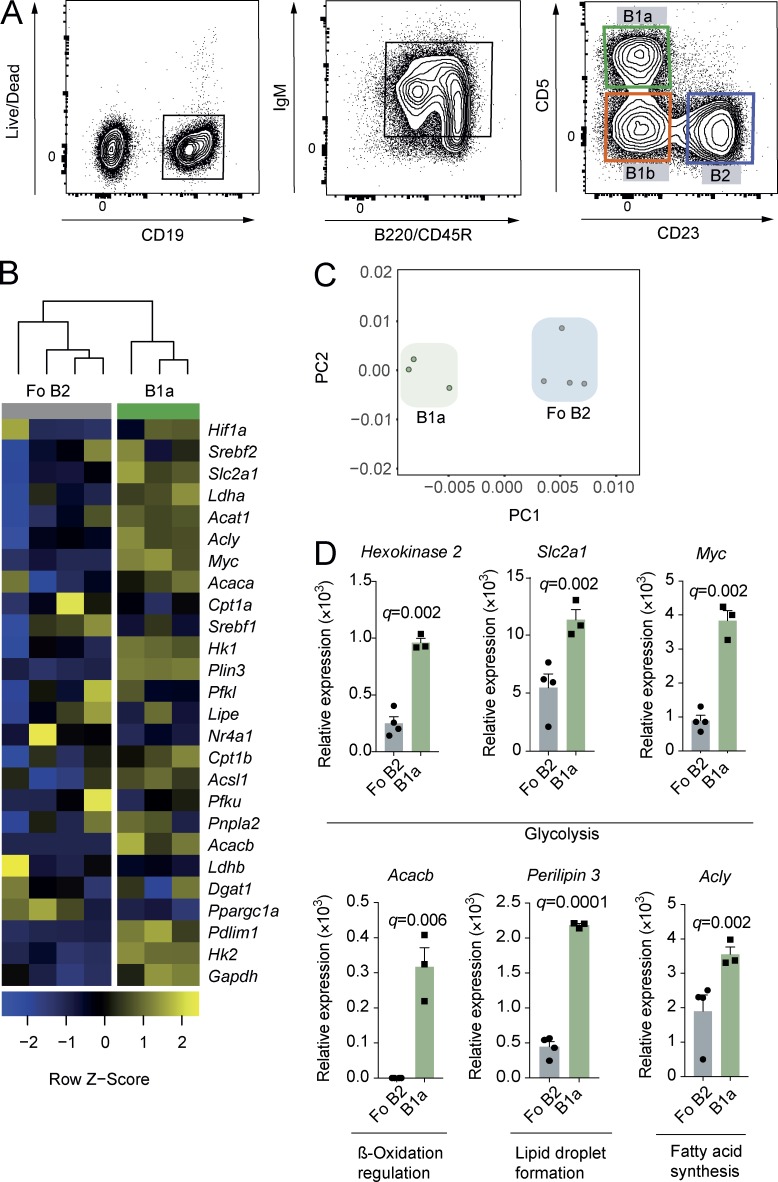
B1a B cells have a distinct metabolic gene transcription identity. (A) Gating strategy for the identification of mouse peritoneal B cell subsets. B1a B cells were identified as viable, CD19+, IgMhi, B220lo, CD23−, or CD5+. B2 B cells were CD23+CD5−. B1b B cells were CD23−CD5−. (B) Heat map of Fluidigm Biomark qRT-PCR gene expression data for peritoneal B1a B cells (CD19+C23−CD5+) and splenic Fo B2 B cells (CD19+CD23+). 1,000 cells were sorted by flow cytometry according to the gating strategy in A, and qRT-PCR was performed for a curated metabolic gene set (Table S1). Data are target gene expression relative to β-actin, and heat map coloring is based on row Z score. Each data point represents one C57BL/6 WT mouse and is the mean of two technical replicates. Hierarchical clustering is unsupervised. (C) Principal component analysis of data from B. First and second principal components are plotted. (D) Gene expression data from B. Each data point is one mouse, with two technical replicates each. Unpaired Student’s t test p-value is adjusted for multiple testing (q-value; using FDR method; 5% threshold). The post-hoc p-value for Acly is presented unadjusted. Each significantly differentially expressed gene was independently confirmed by qRT-PCR. Mean ± SEM is depicted.

