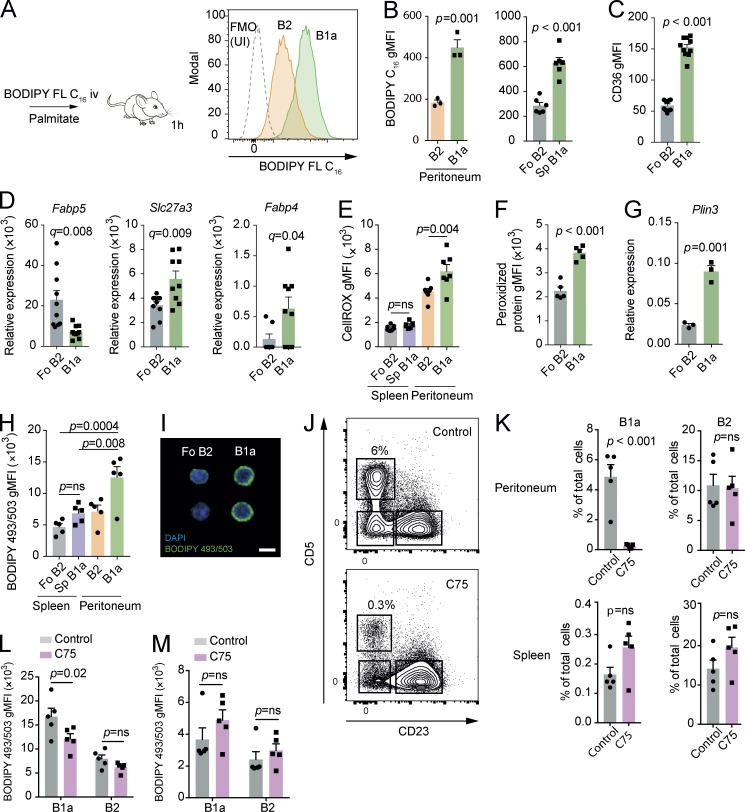
Figure 3.
B1 B cells take up exogenous lipids and undergo cell death in response to inhibition of fatty acid synthesis. (A) Experimental schematic and example histograms. 6-wk-old C57BL/6 mice were injected i.v. with BODIPY FL C16 and then analyzed after 1 h. Example distributions of fluorescence from peritoneal B1a and B2 B cells analyzed by flow cytometry compared with an uninjected (UI) control. FMO, fluorescence minus one. (B) gMFI of BODIPY FL C16 from peritoneal B cells after injection. n = 3 biological replicates representative of or pooled from two independent experiments. Unpaired Student’s t test used. (C) gMFI of CD36 on peritoneal B1a and splenic Fo B2 B cells from 6-wk-old C57BL/6 mice. Each point represents a single mouse, and data are pooled from two independent experiments. Unpaired Student’s t test used. (D) Peritoneal B1a and splenic Fo B2 B cells were sorted by flow cytometry from 6-wk-old C57BL/6 mice, and qRT-PCR was performed for the indicated genes, relative to B2m. Each point represents a single mouse, and data are pooled from two independent experiments. Unpaired Student’s t test p-value is adjusted for multiple testing using FDR method (q-value; 5% threshold). (E) gMFI of CellROX from splenic and peritoneal B cells of 6-wk-old C57BL/6 mice. n = 5 biological replicates. One-way ANOVA with Dunnett correction for multiple comparisons used. n = 5 biological replicates. Representative of two independent experiments. (F) gMFI of Alexa Fluor 488–ClickIT lipid peroxidation assay for peritoneal B1a and splenic Fo B2 B cells of 6-wk-old C57BL/6 mice. n = 5 biological replicates. Unpaired Student’s t test used. Representative of two independent experiments. (G) Expression of Plin3 relative to B2m in flow-sorted peritoneal B1a and splenic Fo B2 B cells from 6-wk-old C57BL/6 mice. n = 3 biological replicates. Unpaired Student’s t test used. Representative of two independent experiments. (H) gMFI of BODIPY 493/503 in splenic Fo B2 B cells and peritoneal B1a and B2 B cells of 6-wk-old C57BL/6 mice. n = 5 biological replicates, pooled from two independent experiments. One-way ANOVA with Dunnett correction for multiple comparisons used. (I) Representative microscope images of BODIPY 493/503 staining in flow-sorted peritoneal B1a and splenic Fo B2 B cells in 6-wk-old C57BL/6 mice. Bar, 20 µm. Representative of two independent experiments. (J–M) 6-wk-old C57BL/6 mice received i.p. injections of C75 (15 mg⋅kg−1) every 2 d for three doses before sacrifice. Shown are representative flow cytometry plots of peritoneal CD19+ B cells from C75 injected and control mice (H). Shown is the percentage of the indicated population of total cells in the analyzed compartment (I) or the gMFI of BODIPY 493/503 measured by flow cytometry (J and K). Each point represents one mouse. Unpaired Student’s t test used in I, two-way ANOVA with Sidak correction for multiple testing used in J and K. Representative of three independent experiments. Mean ± SEM is depicted. ns, not significant.

