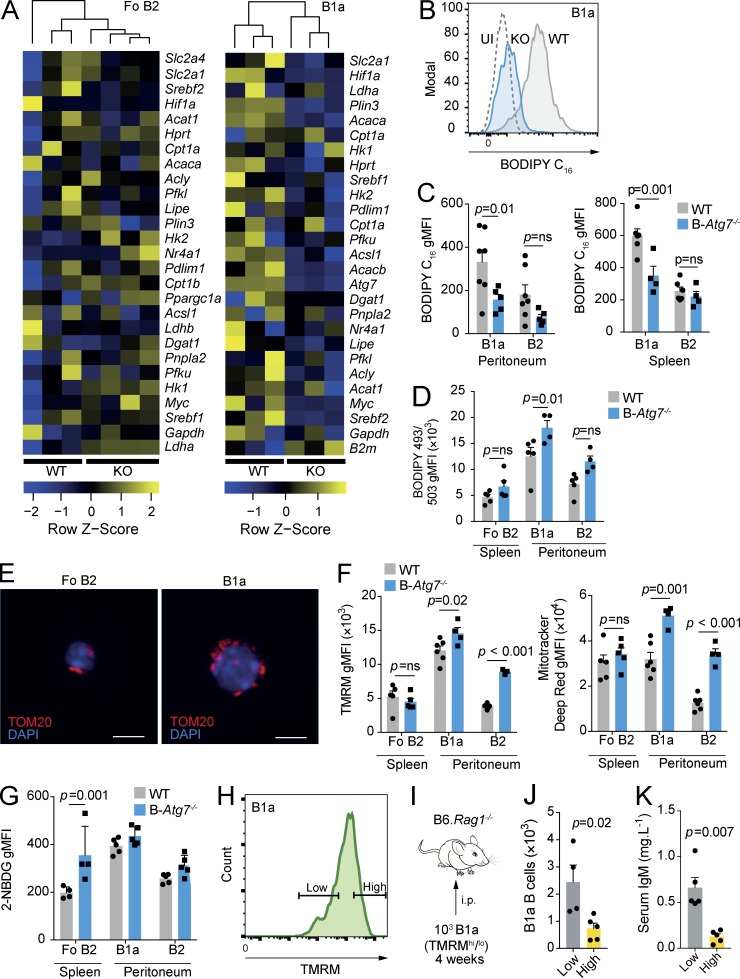
Figure 5.
Loss of autophagy leads to disrupted B1a B cell metabolic homeostasis. (A) Heat map of Fluidigm Biomark qRT-PCR gene expression data for peritoneal B1a B cells and splenic Fo B2 B cells (CD19+CD23+) from control and B-Atg7−/− mice. Data are relative to β-actin, and coloring is based on row Z score. Each data point is the mean of three technical replicates. Hierarchical clustering is unsupervised. (B) Example distributions of fluorescence of BODIPY FL C16 from peritoneal B1a B cells from control and B-Atg7−/− mice measured by flow cytometry and compared with an uninjected (UI) WT control. (C) gMFI of BODIPY FL C16 in B1a and B2 B cells from peritoneum and spleen in control and B-Atg7−/− mice measured by flow cytometry. (D) gMFI of BODIPY 493/503 in B1a and B2 B cells from peritoneum and spleen in control and B-Atg7−/− mice measured by flow cytometry. (C and D) Each point represents one mouse. Data pooled from two independent experiments. Two-way ANOVA with Sidak correction for multiple testing used. (E) Representative immunofluorescent confocal images of the mitochondria of sorted WT Fo B2 and peritoneal B1a B cells. Cells are stained for TOM20 and nuclei are visualized with DAPI. Bars, 5 µm. (F) gMFI of TMRM and MitoTracker deep red in B cells from the spleen and peritoneum in control and B-Atg7−/− mice measured by flow cytometry. Each point represents one mouse. Data representative of two independent experiments. Two-way ANOVA with Sidak correction for multiple testing used. (G) gMFI of 2-NBDG in B1a and B2 B cells from peritoneum and spleen in control and B-Atg7−/− mice measured by flow cytometry. Each point represents one mouse. Data pooled from two independent experiments. Two-way ANOVA with Sidak correction for multiple testing used. (H) Flow cytometry gating definition of high and low levels of TMRM fluorescence. The highest and lowest quartiles of the distribution were used to define TMRMhi and TMRMlo populations of B1a B cells. (I) Experimental schematic. 103 B1a B cells from the lowest and highest quartiles of TMRM fluorescence were sorted and adoptively transferred into the peritonea of B6.Rag1−/− hosts. These mice were then analyzed after 1 mo. (J) Quantification of peritoneal B1a B cells from I. (K) Quantification of serum IgM levels from I. (J and K) Each point represents one mouse. Unpaired Student’s t test used. Data representative of two independent experiments. Mean ± SEM is depicted.

