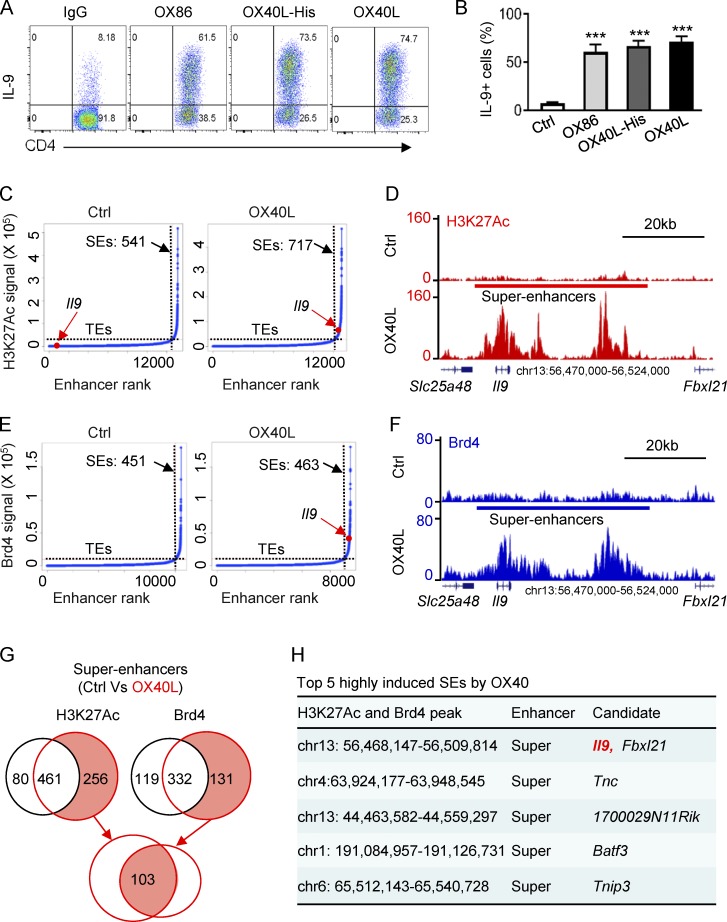
Figure 1.
Identification of SEs in Th9 cells induced by OX40 stimulation. (A) The FACS plots depict Th9 cells induced by TGF-β and IL-4 with or without OX40 stimulation. Naive CD4+ T cells were activated by anti-CD3/APCs, and OX40 stimulation was provided by an agonist anti-OX40 mAb (OX86), OX40 ligand-His recombinant protein (OX40L-His), or OX40 ligand transgenic APC (OX40L). An isotype control IgG was used as control. Representative plots from one of five independent experiments. (B) Summary of Th9 cells induced as described in A from five independent experiments. (C) Distribution of SEs based on H3K27Ac tag signals and enhancer ranks in control Th9 (Ctrl) and OX40-induced Th9 cells (OX40L). The number denotes the SEs induced in Th9 cells with or without OX40 costimulation. The red dot shows the positions of Il9 TE and Il9 SE. (D) ChIP-seq profiles showing levels of genome-wide H3K27 acetylation in control Th9 cells (Ctrl) and OX40-induced Th9 cells (OX40L). The position of SE and the Il9 locus are highlighted. (E) Distribution of SE in control Th9 (Ctrl) and OX40-induced Th9 cells (OX40L) based Brd4 tag signals and enhancer ranks. The number denotes the SEs identified in Th9 cells, and the red dot shows the position of Il9 SE. (F) Brd4 ChIP-seq profiles showing enrichment of Brd4 in Th9 cells induced with or without OX40 costimulation. The position of SE and Il9 locus is shown. (G) The Venn diagrams show the number of unique and overlapping SEs induced by OX40 based on the H3K27Ac and Brd4 ChIP-seq signals. (H) The top five SEs induced by OX40 ranked by fold changes of both H3K27Ac and Brd4 ChIP-seq signals. Graphs in B depict mean ± SEM of five experiments, each with triplicate cultures. Statistical differences between groups were determined by the Student’s t test. ***, P < 0.001.

