Figure 6.
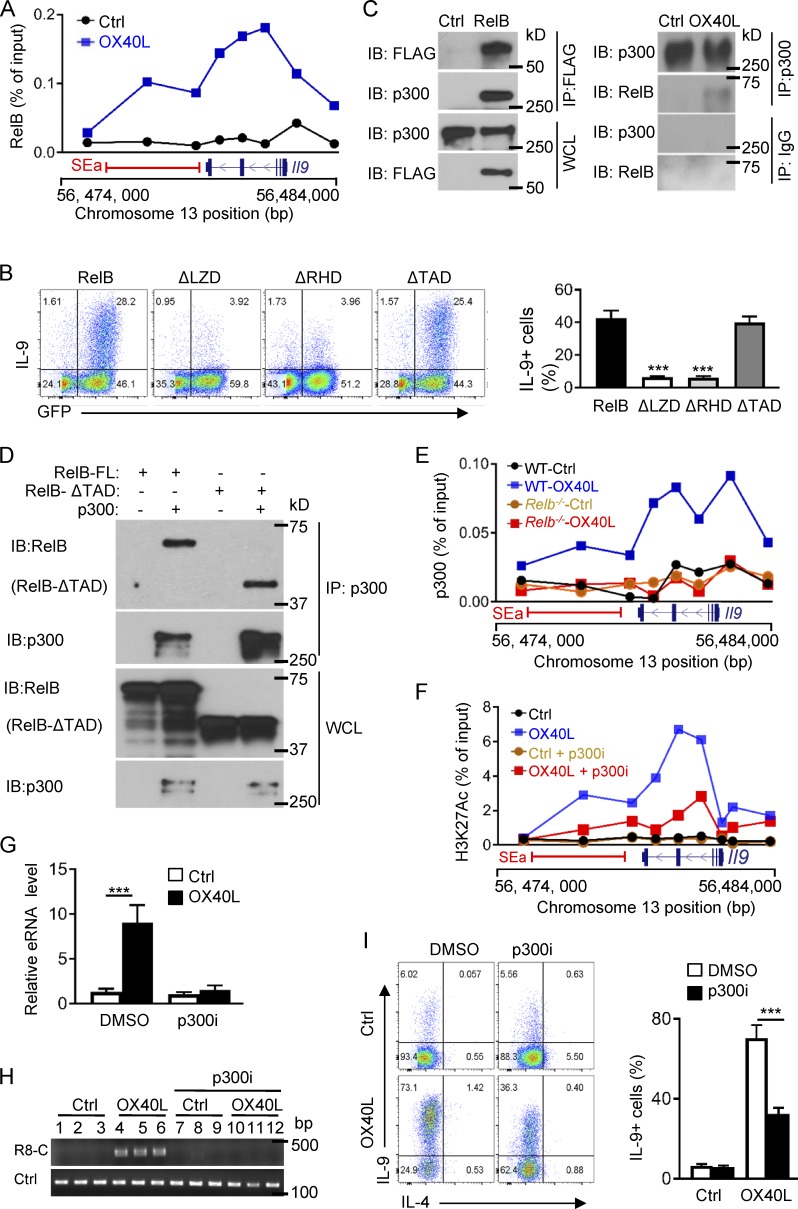
Formation of SEs requires the histone acetyltransferase p300. (A) ChIP assay showing RelB enrichment at the Il9 coding region and the SEa region in Th9 cells induced with (OX40L) and without OX40 stimulation (Ctrl). (B) Wt B6 CD4+ T cells transduced with retroviral vectors expressing full-length RelB or RelB mutants, with specific deletion of the LZD (ΔLZD), RHD (ΔRHD), or TAD (ΔTAD), and then cultured under Th9 cell conditions for 3 d. The FACS plots depict a representative experiment in Th9 cell induction. The bar graphs on the right side show quantification of Th9 cells from three independent experiments. (C) Coimmunoprecipitation analysis showing RelB and p300 interactions. FLAG-tagged RelB was introduced into CD4+ T cells and cultured under Th9 cell conditions. Left: RelB was immunoprecipitated with anti-FLAG mAb, followed by immunoblotting for p300 using anti-p300 mAb. Right: P300 was immunoprecipitated from control Th9 cells and OX40-induced Th9 cells, followed by immunoblotting for RelB. WCL was included as a positive control. (D) Full-length RelB or RelB with TAD deletion (RelB-ΔTAD) was introduced into 293 T cells, along with p300, and binding of RelB to p300 was determined by Co-IP experiments. The blots show binding of p300 to full length and TAD-deleted RelB. WCL was included as a control. (E) ChIP assay showing binding p300 to the Il9 coding region and the SEa region in WT B6 and Relb−/− Th9 cells induced with or without OX40 stimulation. (F) H3K27Ac ChIP data showing levels of H3K27 acetylation at Il9 locus and the SEa region in control Th9 cells and OX40-induced Th9 cells with or without addition of the p300 inhibitor SGC-CBP30 (p300i). (G) Expression of eRNA from Il9 SEa (a4) by control Th9 cells and OX40-induced Th9 cells treated with the p300 inhibitor or DMSO vehicle control. (H) 3C assay measuring DNA loop formations based PCR products amplified by R8 and C primer sets in control Th9 cells and OX40-induced Th9 cells with or without the p300 inhibitor. (I) A representative FACS plot showing induction of Th9 cells by OX40 in the presence of the p300 inhibitor or DMSO as a control. The bar graphs on the right show summary of Th9 cells with or without the p300i inhibitor. All graphs are representative images from at least three independent experiments, and bar graphs shown are mean ± SEM of three independent experiments with triplicate cultures. ***, P < 0.001.

