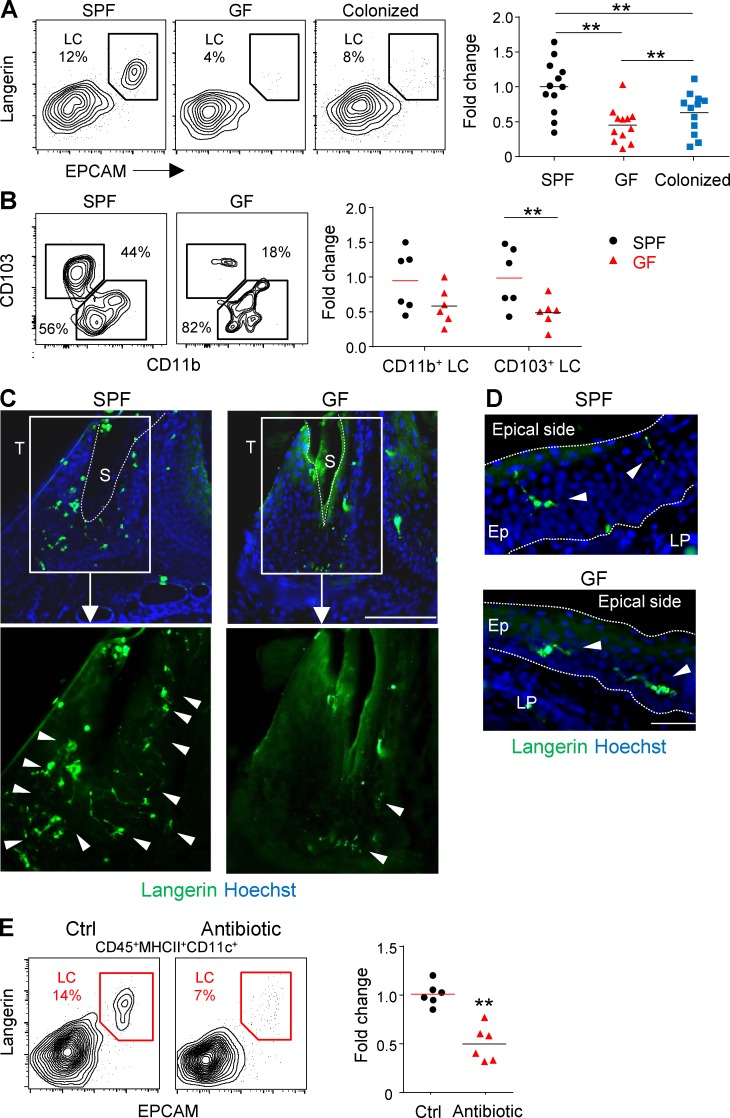
Figure 6.
Commensal microbiota regulates the frequencies of mucosal LC. (A) Gingival mucosal tissue from adult Swiss Webster SPF mice, GF mice, and GF mice cohoused with SPF mice for 2 mo was processed and analyzed by flow cytometry to examine the percentages of LCs. Representative flow cytometry plots present the frequencies of gingival LCs (CD45+CD11c+MHCII+langerin+EpCAM+). Graph presents the fold change in absolute numbers of LCs normalized to SPF mice and (mean). Results pooled from four independent experiments are shown; each experiment included three separately analyzed mice. (B) Representative plots illustrate the percentages of CD103+LCs and CD11b+LCs in SPF and GF mice. Graph presents the fold change in absolute numbers of the two LC subsets normalized to SPF mice presented as the mean. Results pooled from two independent experiments are shown, each experiment included three separately analyzed mice. (C and D) Representative immunofluorescence images of gingival cross section prepared from adult SPF and GF mice, stained for langerin (green) and Hoechst (blue). Confocal microscopy images from one out of three independent experiments are presented. Arrowheads indicate the location of LCs, and the dotted line specifies the sulcus region or the basal and epical ends of the epithelium. S, sulcus; T, tooth. (E) Adult SPF B6 mice were treated with a broad-spectrum antibiotic cocktail in the drinking water for 2 mo. Representative flow cytometry plots demonstrate the percentages of LCs in gingival tissues of antibiotic-treated mice and control group. Graph presents the fold change in the absolute numbers of LCs normalized to SPF mice and presented as the mean. Results pooled from two independent experiments are shown, each experiment included three separately analyzed mice. Bars, 50 µm. **, P < 0.001.

