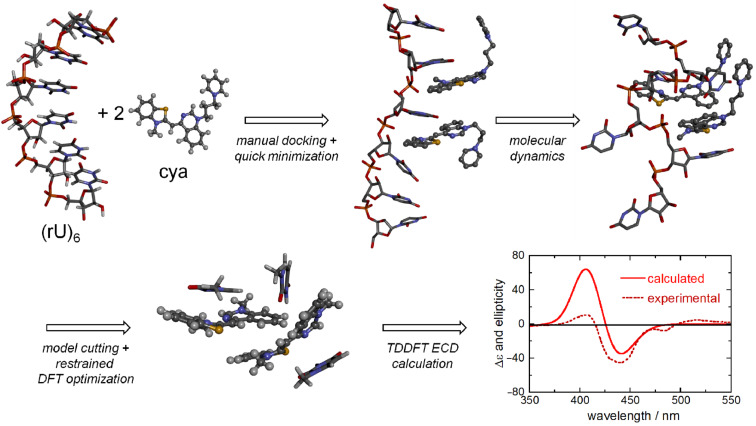
Figure 13.
Schematic representation of the main steps for calculating the ICD spectrum of a ligand bound to a single-stranded RNA. In this case, a double binding of cyanine ligands (cya) was expected to occur in two consecutive binding sites. In the final model for ECD calculations, two “cya” molecules and the three closest nucleobases found after MD were considered. The ICD is exciton-like and is dominated by the exciton coupling between the cyanine ligands. Adapted from [30].

