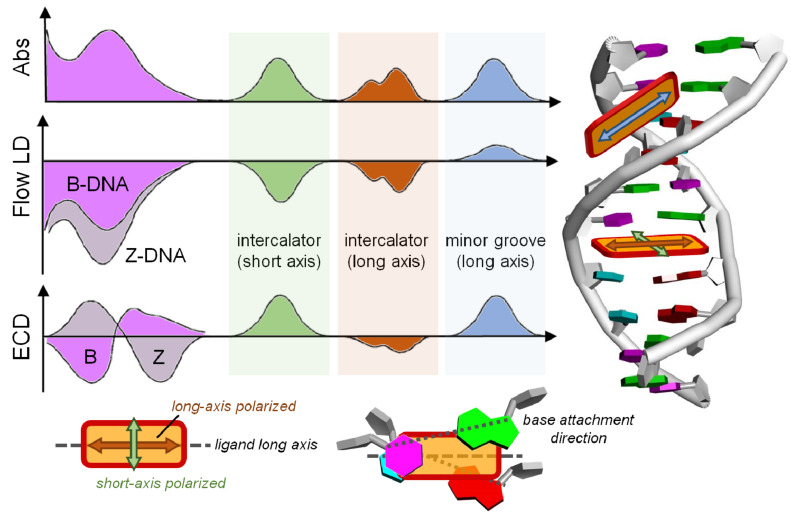
Figure 7.
Empirical analysis of ECD and flow LD spectra to establish the preferred orientation of a ligand bound to DNA. We define the transition moment of the ligand oriented “parallel” to the long axis of adjacent base pairs, when it is halfway between the closest base attachment directions (bottom right panel). The LD is sensitive to the arrangement of the dye transition moment with respect to the helix axis, and to the overall orientation of the DNA double helix with respect to the flow direction (see Figure 9, below); Z-DNA is easier to orient than B-DNA because of a more extended elongation. ECD in the region <300 nm reflects the DNA conformation, in particular the mutual arrangement between nucleobases, which is different for right-handed B and left-handed Z-DNA. In the region >300 nm, the ligand ICD depends on the arrangement of the ligand chromophore with respect to the nucleobases. The sign of ICD is opposite for mutually orthogonal transition moments (long vs short axis) allied with an intercalated chromophore.

