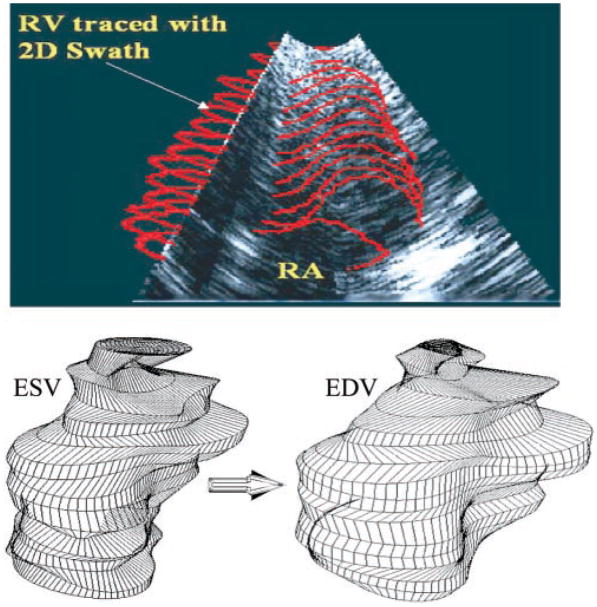
Fig. 3.
Top: RV endocardial border of each C-mode slice is traced manually as a closed loop representing an initial guess. Two-dimensional (2-D) “swath” border detection algorithm then adjusts the initial guess so that the border falls on the “most likely position” and allows visualization of the stack of 2-D contours of each RT3D frame using the B-mode, as pictured. Bottom: representative end-systolic (ESV) and end-diastolic (EDV) RV chamber reconstructions.

