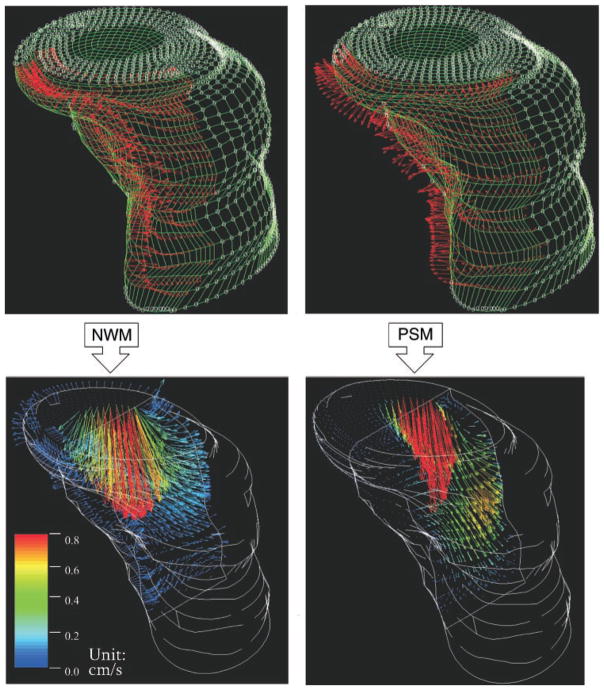
Fig. 9.
Functional imaging of commencing RV inflow using RT3D imaging data, under normal wall motion (NWM) conditions and during volume overload with paradoxic diastolic septal motion (PSM). Top: external (endocardial) surface nodes of instantaneous computational meshes and application of boundary conditions (red velocity vectors on endocardial surface nodes). Only velocity vectors on the septal border of each RV mesh are shown to avoid clutter. Septal nodal velocity vectors (red) point toward RV chamber and free wall in the normal case but toward the left ventricle with PSM. Bottom: median sagittal (anteroposterior) plane “cuts” of the resulting velocity fields at the very start (≈10 ms from onset) of the E-wave. With NWM there is blood flow toward the free wall in the septal region, whereas with PSM there is very little blood flow in that region. Note the different velocity profiles at the tricuspid orifice, and the abrupt transition (deceleration) from red-yellow-green to black in the dilated chamber (PSM) compared with the more gradual transition through blue hues in the normal.

