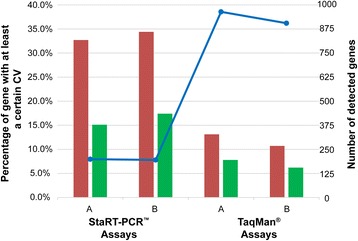
Fig. 1.

Quantitative measurement variation for replicates measured by PCR-based technologies. For each of the sample types (sample A and sample B) measured by StaRT-PCR™ Assays and TaqMan® Assays, the red bar denotes the percentage of genes that shows at least 10% CV and the green bar denotes the percentage of genes that shows at least 15% CV. The total number of such genes within each assay and sample type is noted by blue dots connected by lines and is read on the secondary axis
