Fig. 6.

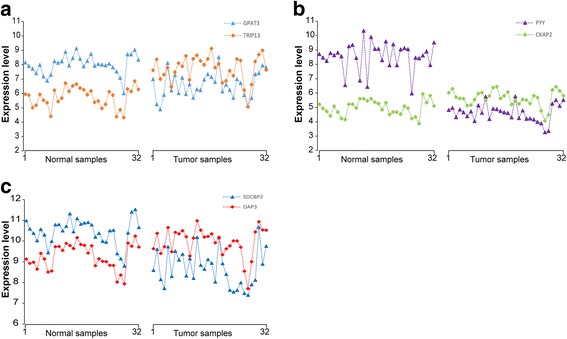
The distribution of the expression levels of the 3 gene-pairs in GSE8671. The gene expression levels of GPAT3 and TRIP13 (a), PYY and CKAP2 (b) and SDCBP2 and DAP3 (c)

The distribution of the expression levels of the 3 gene-pairs in GSE8671. The gene expression levels of GPAT3 and TRIP13 (a), PYY and CKAP2 (b) and SDCBP2 and DAP3 (c)