Fig. 3.

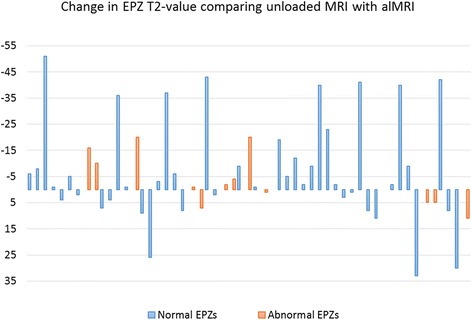
T2 value changes for each of the 55 endplate zones (EPZs). T2 value changes for each of the 55 EPZs between unloaded MRI and alMRI. An increase in T2 values is thus displayed as negative values and a decrease displayed as positive values

T2 value changes for each of the 55 endplate zones (EPZs). T2 value changes for each of the 55 EPZs between unloaded MRI and alMRI. An increase in T2 values is thus displayed as negative values and a decrease displayed as positive values