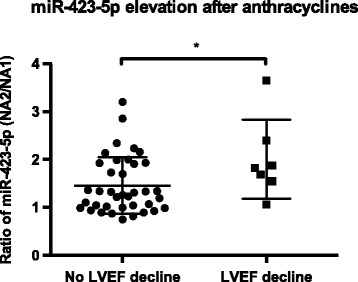
Fig. 4.

Comparison of circulating miR-423-5p elevation directly after anthracyclines between patients with (n = 7) or without (n = 38) LVEF decline. Expression was determined by RT-qPCR at NA1 and NA2 time points. Comparisons between the 2 groups were calculated using the Mann-Whitney U test. The data are expressed as the mean ± SEM
