
Fig. 3.
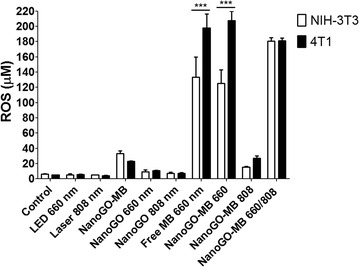
ROS production in NIH/3T3 and 4T1 cells after PDT only or PTT only and PDT/PTT combined treatments. A higher ROS production in micromolar was observed in tumor cells (p < 0.001) for PDT treatments only. There was no statistical significance comparing groups PDT or PTT only and PDT/PTT combined treatments for tumor cells. Data are represented as mean ± SEM (n = 3). p values were calculated by the Student’s t test. ***p < 0.001