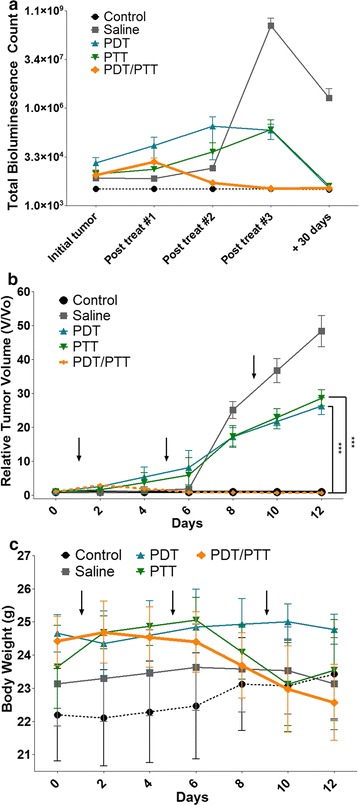
Fig. 6.

Total bioluminescence counts, relative tumor volume and body weight assessment of treated mice. a Tumor growth curves of different 4T1-Luc-bearing mice groups after treatments number 1, 2 and 3 (post treat #1, post treat #2 and post treat #3, respectively). The tumor volumes were normalized to their initial sizes. Statistical significance between the saline only, PDT only and PTT only groups due to the evident reduction of bioluminescence on the combined PDT/PTT group (n = 5). b The growth of 4T1-Luc tumors in different groups of mice during and after treatment. p value was calculated by the Student’s t test, ***p < 0.001. c Mean mice body weights from different groups after treatment. Arrows indicate when treatments and irradiations were performed. All data are presented as mean ± SD
