Fig. 2.

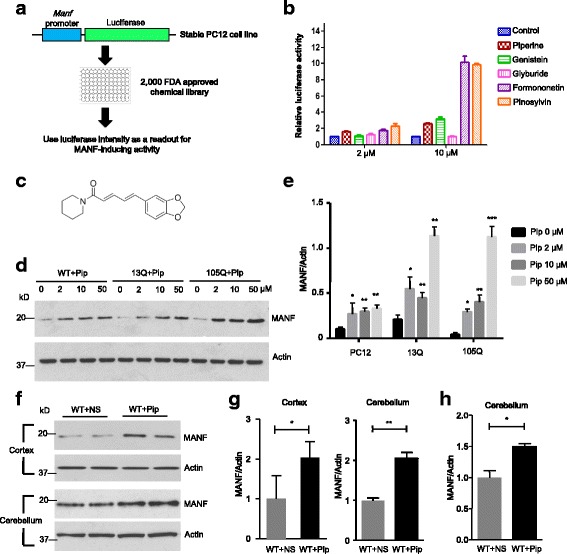
Large-scale drug screening identified piperine as a MANF expression inducing agent. a Schematic representation of the design for large-scale drug screening. b Luciferase intensity of stable PC12 cells treated with different drugs (Piperine, Genistein, Glyburide, Formononetin and Pinosylvin) at different concentrations (2 μM and 10 μM). Cells treated with DMSO only were used as a control (n = 3). c Chemical structure of piperine. d Western blotting analysis of WT, TBP-13Q, and TBP-105Q PC12 cells treated with different concentrations (2 μM, 10 μM and 50 μM) of piperine for 48 h. Cells treated with DMSO (0 μM) only were used as a control. Actin was used as a loading control. e Quantification of the ratio of MANF to actin on western blots in Fig. 2d (n = 3, * P < 0.05, ** P < 0.01, *** P < 0.001). f Western blotting analysis of MANF expression in the cortex and cerebellum of WT mice after 2-month treatment with either saline (WT + NS) or piperine (10 mg/kg, WT + Pip). Four mice per group were used for analysis. g Quantification of western blotting result in Fig. 2f (n = 4, * P < 0.05, ** P < 0.01). h qRT-PCR analysis of MANF mRNA level in the cerebellum of WT mice after 2-month treatment with either saline (WT + NS) or piperine (10 mg/kg, WT + Pip) (n = 3, * P < 0.05). Results are presented as mean ± SEM
