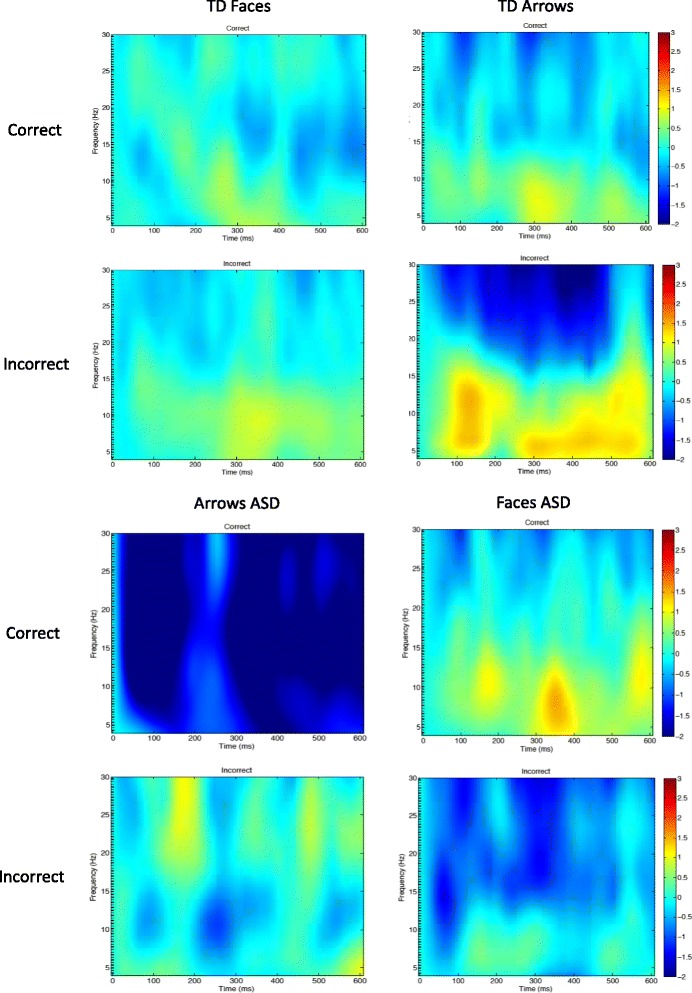
Fig. 4.

a Post-feedback ERSP for typically developing (TD) children in the theta (4–6 Hz) and alpha band (8–12 Hz). Activity after social (face) stimuli is shown on the left, and activity after nonsocial (arrow) stimuli is shown on the right. Activity after “correct” feedback is shown in the top row, and activity after “incorrect” feedback is shown in the bottom row. b. Post-feedback ERSP for children with ASD children in the theta (4–6 Hz) and alpha band (8–12 Hz). Activity after social (face) stimuli is shown on the left, and activity after nonsocial (arrow) stimuli is shown on the right. Activity after “correct” feedback is shown in the top row, and activity after “incorrect” feedback is shown in the bottom row
