Fig. 1.

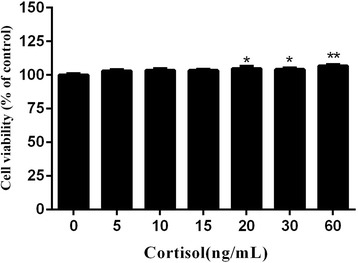
Effects of different concentrations of cortisol on RAW264.7 cell viability as measured by the CCK-8 assay. The data shown are means ± SEM (n = 6). *p < 0.05 and **p < 0.01 vs. control group

Effects of different concentrations of cortisol on RAW264.7 cell viability as measured by the CCK-8 assay. The data shown are means ± SEM (n = 6). *p < 0.05 and **p < 0.01 vs. control group