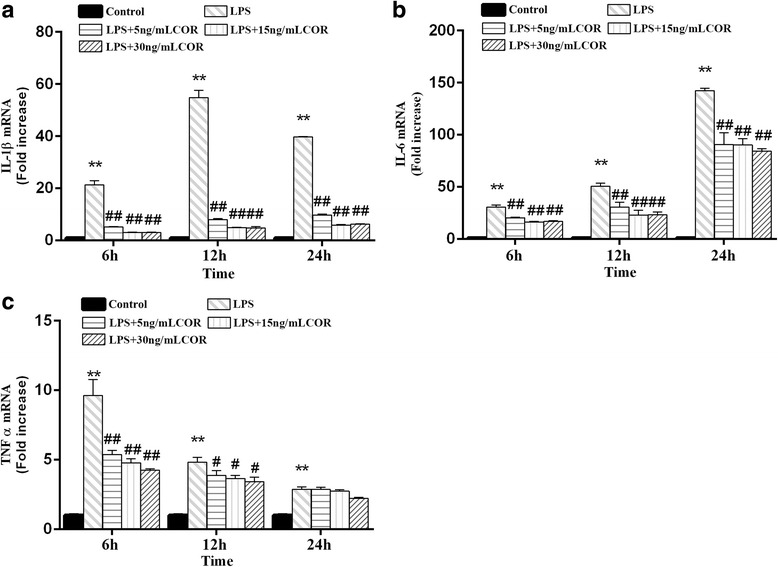
Fig. 4.

Effects of cortisol on IL-1β (a), IL-6 (b) and TNFα (c) mRNA expression in LPS-stimulated RAW264.7 cells. RAW264.7 cells were co-treated with cortisol (5, 15 and 30 ng/mL) and LPS (1 μg/mL) for 0, 6, 12, and 24 h. RNA was isolated and analyzed by RT-PCR. The data presented are the means±SEM. **p < 0.01 vs. the control group; # p < 0.05, ## p < 0.01 vs. the LPS group
