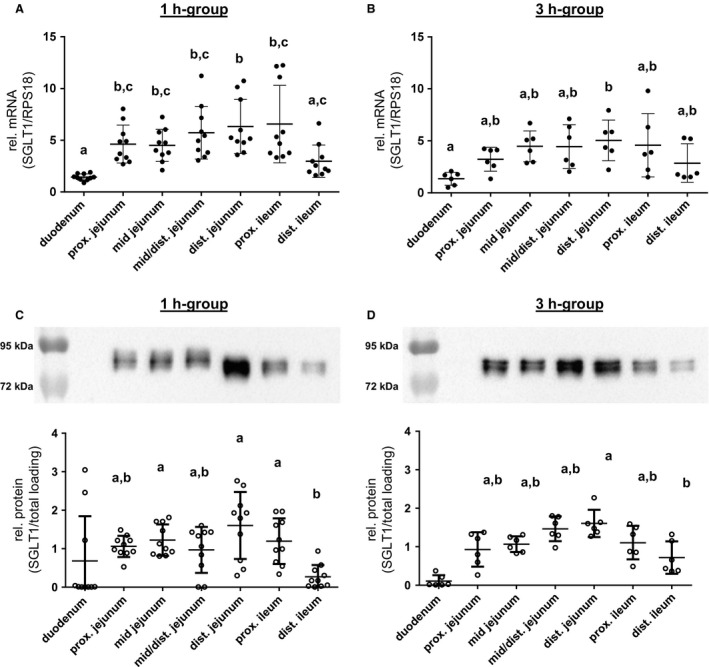
Figure 3.

SGLT1 expression along the small intestinal axis. The SGLT1 mRNA expression levels detected in porcine small intestinal segments of (A) 1 h‐group (N = 10) and (B) 3 h‐group (N = 6) animals are shown. Copy numbers were normalized against RPS18 mRNA values. SGLT1 protein expression along the small intestines is presented relative to total protein loading, and representative western blots of the 1 h‐group (N = 10) (C) and 3 h‐group (N = 6) (D) are included. Scatter plots with means ± SD. Statistical analyses: ANOVA, Kruskal–Wallis test, Dunn's multiple comparisons test. Intestinal segments not sharing the same letters are significantly different (P < 0.05). The duodenal SGLT1 contents in both groups (C, D) were not different from the hypothetical value “0” and excluded from the ANOVA in order to get a more precise analysis of differences between the other intestinal segments, as also explained in the statistics section.
