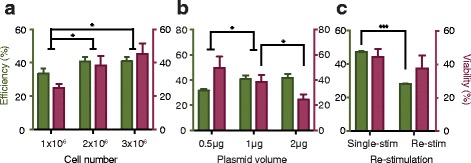
Fig. 3.

Key factors affecting electro-transfection efficiency. Green bars represent the percentage of positively transfected cells, and purple bars represent cell viability. a, b Effects of cell number and plasmid input on transfection results. c Electro-transfection of re-stimulated T cells. Re-stim, re-stimulated cells; single-stim, single-stimulated cells
