
Fig. 5.
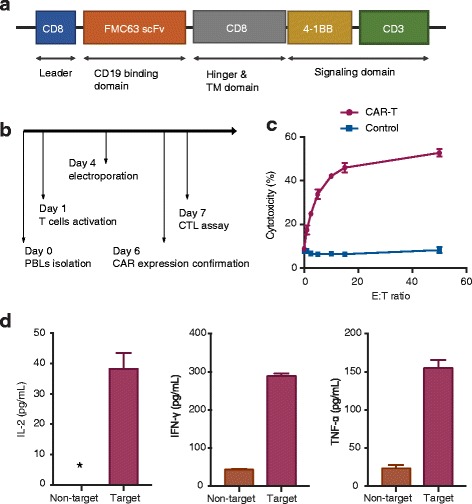
Optimized protocol for the generation of functional CAR-T cells within 1 week. a CAR molecular design. Leader, leader peptide; TM, transmembrane domain. b CAR-T cell production flowchart. c Cytotoxicity of CAR-T cells. E:T ratio represents the ratio of effector and target cells. The red line represents CAR-T cells, and the blue line represents control T cells. d Cytokine production of CAR-T cells. Non-target represents the group of wild-type K562 cells and CAR-T cells. Target represents the group of CD19-expressing K562 cells and CAR-T cells. *The IL-2 production of non-target cells groups was too low (< 3.9 pg/mL) to be calculated by a four-parameter logistic standard curve