
Fig. 1.
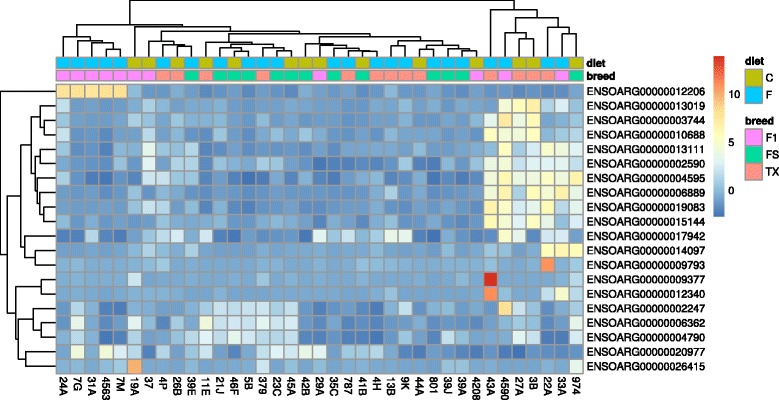
Heatmap plot of the top 20 genes with the highest genetic variance across all samples. Respective diet condition (C = control diet; F = flushing diet) and breed groups (FS = Finnsheep; TX = Texel; F1 = F1 cross of Finnsheep and Texel) of each samples in x-axis are presented at the top of the heatmap