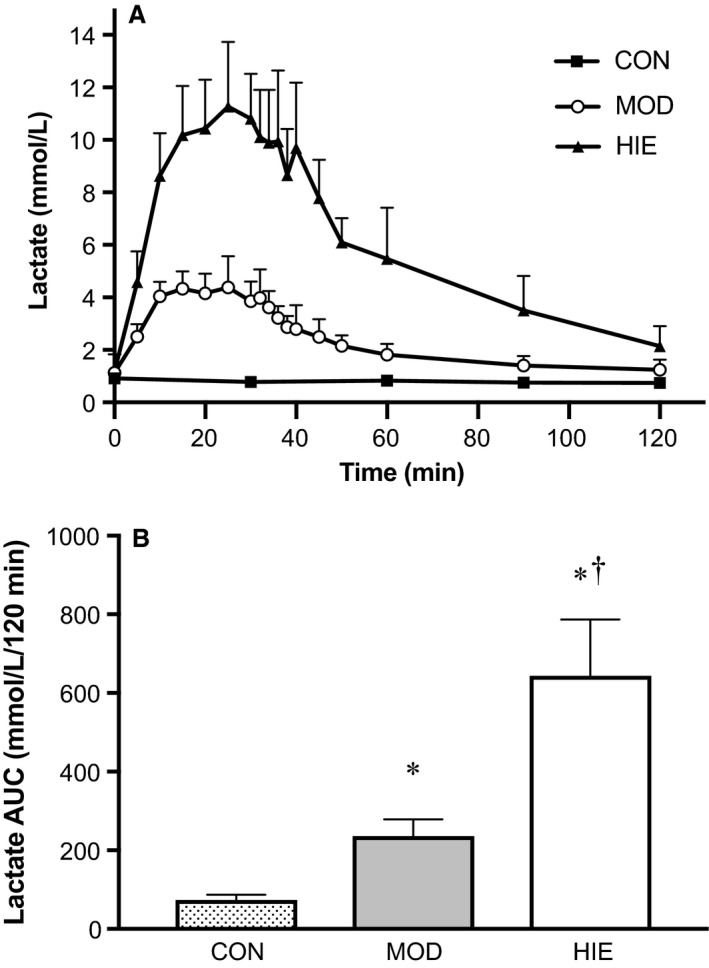
Figure 1.

Lactate response. Lactate response to CON, MOD, and HIE during the first 120‐min of each trial. (A) HIE had the highest lactate response compared to MOD and CON (P < 0.01). (B) Mean lactate AUC by trial. *Compared to CON (P < 0.01), †Compared to MOD (P = 0.025). Error bars represent ± SD. n = 5.
