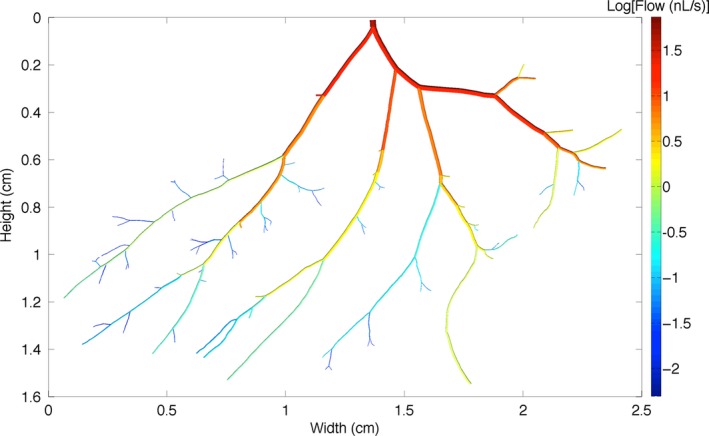
Figure 3.

Reconstructed arteriolar network used in computational modeling. This figure shows the structure of the network used including baseline (control) diameters. The network is color coded based on calculated blood flow rate through vessel segments under control conditions, with red indicating high flow and dark blue indicating low flow.
