
Fig. 2.
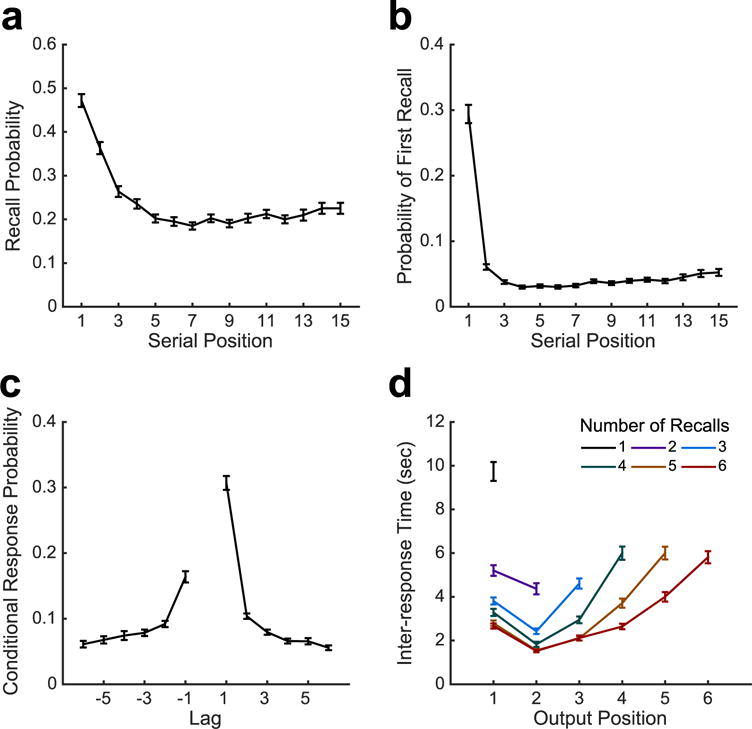
Behavioral results. a. The overall probability that items from each list position were recalled. b. The probability that an item from a given list position was the first item recalled, as a function of serial position. c. The probability that a recall transition will come from a temporally proximal list position, given it is available for recall. d. Inter-response time (measured from onset to onset of response vocalization) as a function of recall sequence length. Error bars represent standard error of the mean.