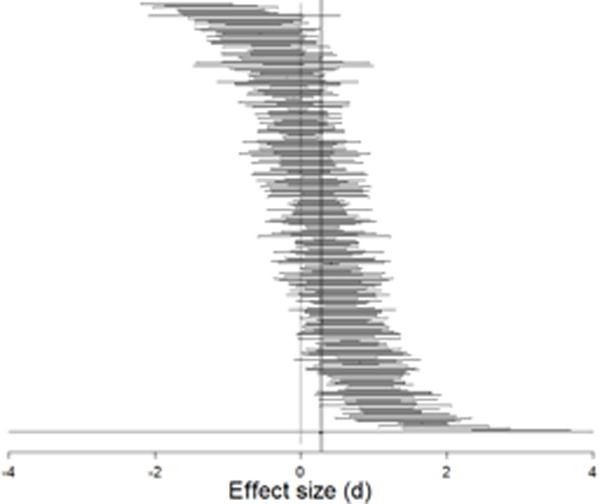
Figure 1.

Forest plot of the effect sizes.
Note: This forest plot includes point estimates and confidence intervals for all studies in the manuscript. The solid vertical line represents the combined effect size (d = .29).

Forest plot of the effect sizes.
Note: This forest plot includes point estimates and confidence intervals for all studies in the manuscript. The solid vertical line represents the combined effect size (d = .29).