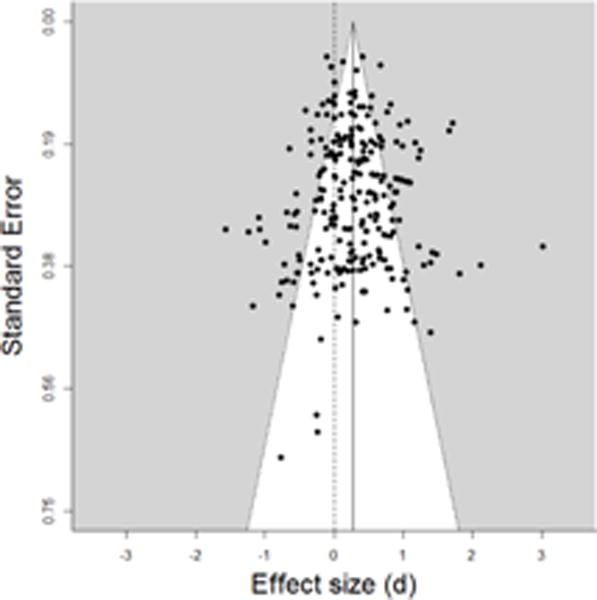
Figure 2.

Funnel plot of effect sizes.
Note: Effect size (d) is plotted on the x-axis and standard error on the y-axis. The solid vertical line represents the combined effect size (d = .29). The dotted line represents the x-intercept (x = 0) for a reference line. The white region represents the inside of the 95% pseudo confidence interval, whereas the shaded region represents the outside (i.e., the area of statistical significance).
