
Figure 3.
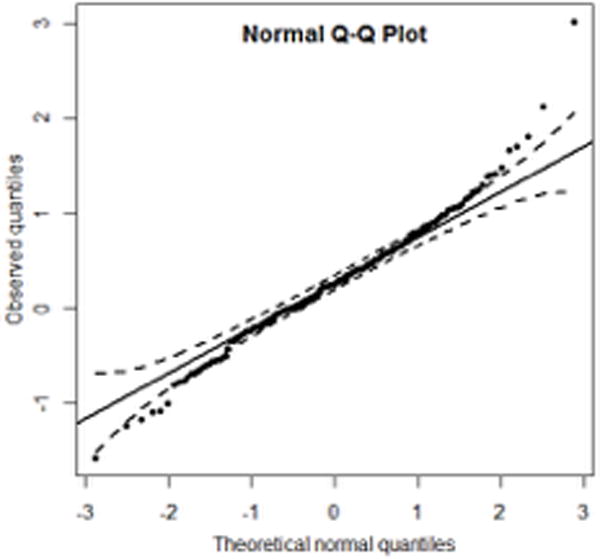
Normal quantile plot.
Note: The dashed lines represents a 95% confidence band. The line on the diagonal indicates normality.
Official websites use .gov
A
.gov website belongs to an official
government organization in the United States.
Secure .gov websites use HTTPS
A lock (
) or https:// means you've safely
connected to the .gov website. Share sensitive
information only on official, secure websites.
Normal quantile plot.
Note: The dashed lines represents a 95% confidence band. The line on the diagonal indicates normality.