
Figure 4. Extraembryonically-targeted CpG islands are pervasively methylated across human cancer types.
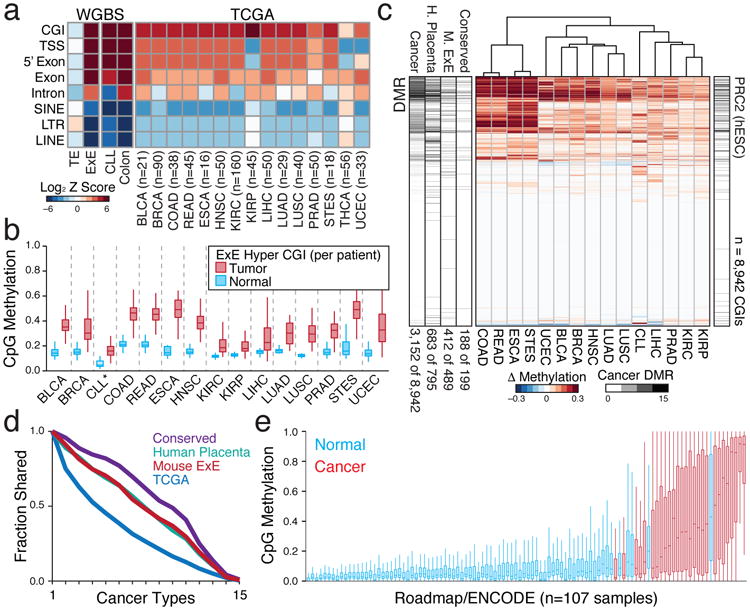
a. Disruption of global methylation creates similar biases for CGIs and promoters between TE/ICM and E×E/Epiblast or patient- or age-matched normal/tumor tissue comparisons. Heatmap shows the log Z score enrichment for features by the binomial test. Of these 16 cancer types, only THCA does not display a notably dysregulated methylome. N's refer to the number of matched tumor/normal tissue isolates for each type. TCGA samples include Bladder Urothelial Carcinoma (BLCA), Breast Invasive Carcinoma (BRCA), Colon Adenocarcinoma (COAD), Colorectal Adenocarcinoma (READ), Esophageal Carcinoma (ESCA), Head and Neck Squamous Cell Carcinoma (HNSC), Kidney Renal Clear Cell Carcinoma (KIRC), Kidney Renal Papillar Cell Carcinoma (KIRP), Liver Hepatocellular Carcinoma (LIHC), Lung Adenocarcinoma (LUAD), Lung Squamous Cell Carcinoma (LUSC), Prostate Adenocarcinoma (PRAD), Stomach and Esophageal Carcinoma (STES), Thyroid Carcinoma (THCA), and Uterine Corpus Endometrial Carcinoma (UCEC). Here, Chronic Lymphocytic Leukemia (CLL) to B lymphocyte comparison is between age-matched samples measured by WGBS.
b. Feature level boxplots of 489 E×E Hyper CGIs that preserve their status in human, calculated as a feature per tumor or normal tissue for the 15 cancer types where CGI methylation is generally apparent. Note: CLL samples were measured by RRBS (n=119) and represent a comparison between age-matched healthy B lymphocytes (n=24). Edges refer to the 25th and 75th percentiles, whiskers the 2.5th and 97.5th percentiles, respectively.
c. Differential methylation heatmap for 8,942 orthologous CGIs measured in TCGA or by RRBS and clustered by Euclidean Distance. DMR bar includes the cumulative number of cancers a given island is called as differentially methylated, as well as the DMR status in either human placenta compared to human embryonic stem cells (hESCs), mouse E×E compared to Epiblast, or shared between both comparisons (Conserved). PRC2 (hESC) denotes regulation by polycomb in hESCs. Numbers reflect the proportion of each set that is differentially methylated in at least one cancer type.
d. Intersection analysis for DMR status across TCGA and CLL samples. Both Placenta and E×E DMRs are similarly enriched for methylation in at least one human cancer type (86% and 84% respectively, compared to 35% for all CGIs) and are more frequently methylated across them. Inter-tumor enrichment for conserved DMRs is greater than for extraembryonic DMRs from each individual species, and 94% are methylated in at least one cancer type.
e. Boxplots of orthologous E×E Hyper CGIs across 107 ENCODE/Roadmap samples, ranked by mean methylation and with cancer or cancer-cell line assignment highlighted (red). “Normal” assigned samples that sort with cancer include the trophoblast cell line HTR8svn, primary colon and colonic mucosa, placenta, and CD8+ T lymphocytes, in descending order. Extended Data Fig. 9 or Supplementary Table 7 includes additional sample characteristics.