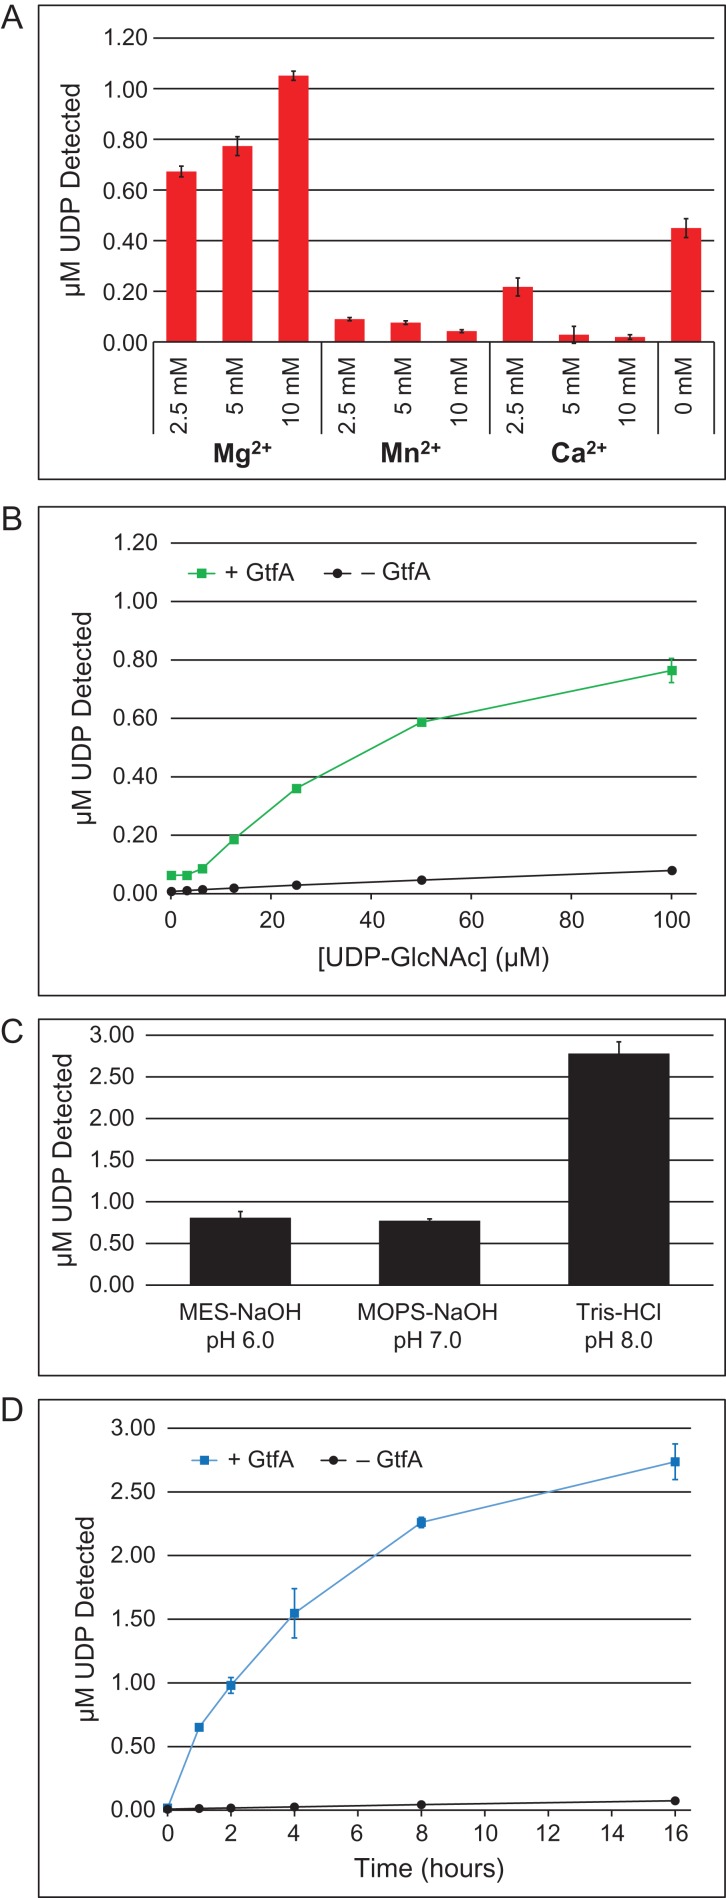
Fig. 3.
Optimization of GtfA-catalyzed hydrolysis of UDP-GlcNAc. (A) GtfA (3 µg) was incubated with 50 µM of UDP-GlcNAc in 0.1 M MES-NaOH (pH 7.0) and the indicated concentration of divalent cation (Mg2+, Mn2+ or Ca2+) for 16 h at 37°C. (B) Same as in Panel A ± GtfA (3 µg), except with 10 mM MgCl2 and varying concentration of UDP-GlcNAc (0–100 µM). (C) Same as in Panel A, except with 10 mM MgCl2 and different pH buffers as indicated. Data are represented as the ratio of the UDP detected from the GT-containing reactions to the respective negative controls, which have all reaction components without GTs. (D) Time course experiment with ±GtfA (3 µg) in the optimized buffer consisting of 0.1 M Tris–HCl (pH 8.0), 10 mM MgCl2 and 100 µM UDP-GlcNAc. In all panels, the release of UDP was detected by the UDP-GloTM assay. Data are representative from three trials, and error bars represent standard deviation. This figure is available in black and white in print and in color at Glycobiology online.

