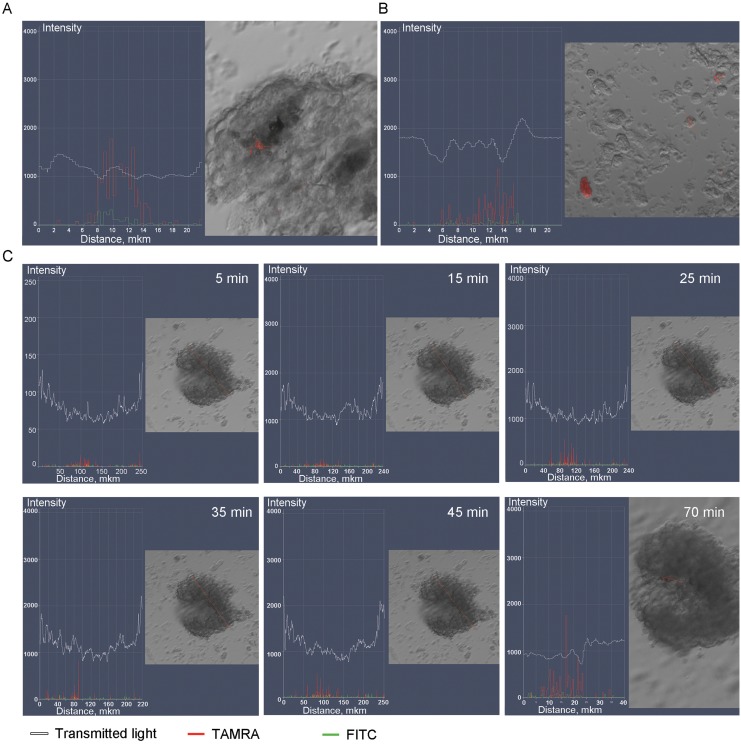
Figure 1.
Analysis of TAMRA-labeled Alu DNA probe accumulation in the neurospheres. A, Fragment of a neurosphere with a single TAMRA+ cells. B, Individual cells scattered through the slide are also TAMRA+. C, Time-lapse imaging of progressive TAMRA signal accumulation in the neurospheres. White curve denotes a transmitted light profile of the neurosphere, red and green graphs correspond to the TAMRA (specific) and FITC (nonspecific fluorescence) channels. The signal magnitude increases until 25 minutes and plateaus thereafter; at 70 minutes, individual cells may show even stronger specific fluorescence.

